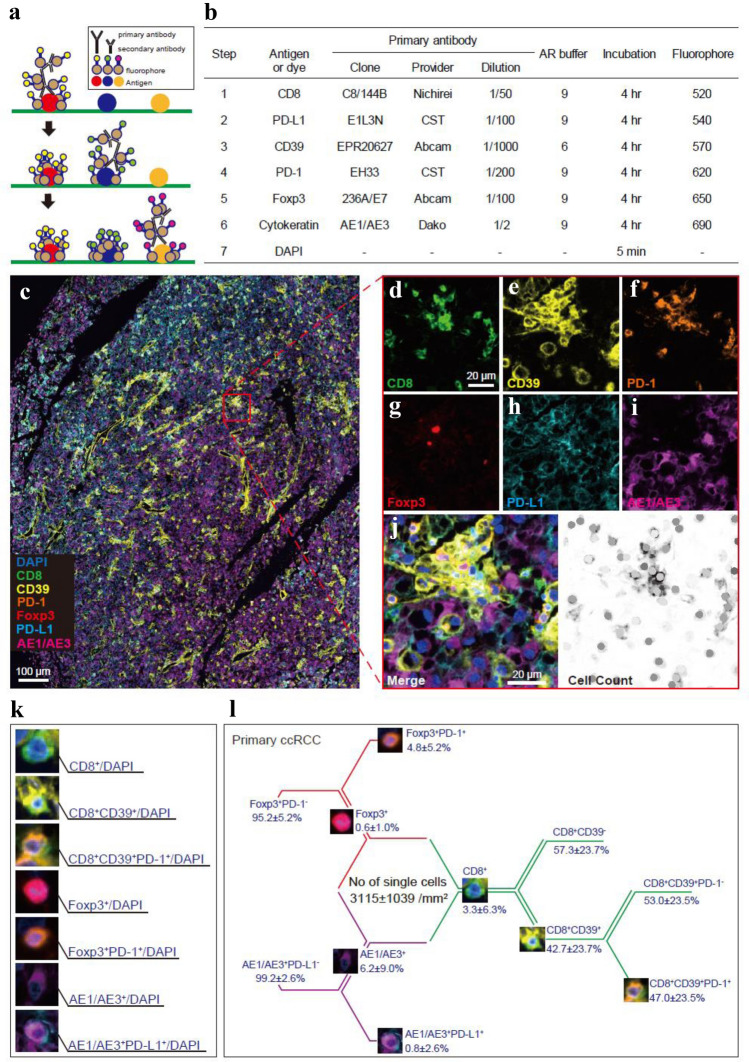
Fig. 1.
Quantitative seven-color multiplexed single-cell analysis of human ccRCC reveals CD8+ T-cell heterogeneity along with immunosuppressive cells. a Workflow of the present multiplexed immunofluorescence staining technique. b The antibodies used and protocol of sequential multiplex staining. AR, antigen retrieval. CST, cell signaling technology. c Representative image of ccRCC displaying multispectral seven-color fluorescence signals for CD8, CD39, PD-1, Foxp3, PD-L1, and AE1/AE3 together with DAPI. Scale bar, 100 μm. d–i Zoomed-in images of the indicated boxed regions in c showing each single fluorophore signal representing CD8 (d), CD39 (e), PD-1 (f), Foxp3 (g), PD-L1 (h), and AE1/AE3 (i). j Cellular phenotyping map of the indicated boxed regions in c. Scale bar, 20 μm. k Cell-by-cell images of each defined cell phenotype. l Summary of the percent distribution by cell phenotype in the tumor central area from 97 primary ccRCC specimens

