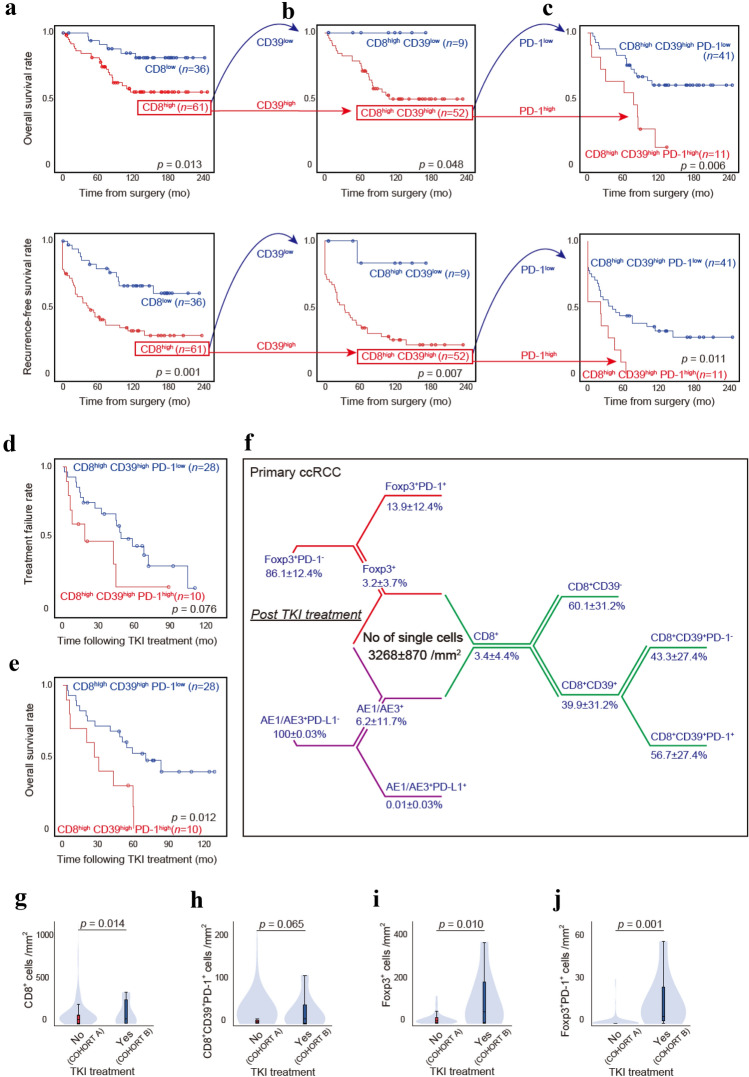
Fig. 2.
Relationships between CD8+ T-cell subpopulations and outcomes. a–c Kaplan–Meier survival curves for overall mortality and recurrence-free survival in 97 ccRCC patients following surgery according to the indicated CD8+ T-cell subpopulations: CD8low versus CD8high (a), CD8highCD39low versus CD8highCD39high (b), and CD8highCD39highPD-1low versus CD8highCD39highPD-1high (c). d–e Kaplan–Meier survival curves for the treatment response (d) and overall mortality (e) in 38 ccRCC patients receiving antiangiogenic TKIs based on the indicated CD8+ T-cell subpopulations. p values were obtained from the log-rank test. f Summary of the percent distribution by cell phenotype in the central tumor from eight primary ccRCC specimens post-TKI treatment. g–j Density of CD8+ T-cells (g), CD8+CD39+PD-1+ T-cells (h), Foxp3+ Treg cells (i), and Foxp3+PD-1+ Treg cells (j) in ccRCC tumors without (COHORT A)/with (COHORT B) TKI treatment prior to surgery. The data are presented using violin and box plots. The line within the box is the median, the upper and lower ends of the box are the upper and lower quartiles, and the bars are the minimum and maximum values. p values were obtained from the two-tailed Mann–Whitney U test

