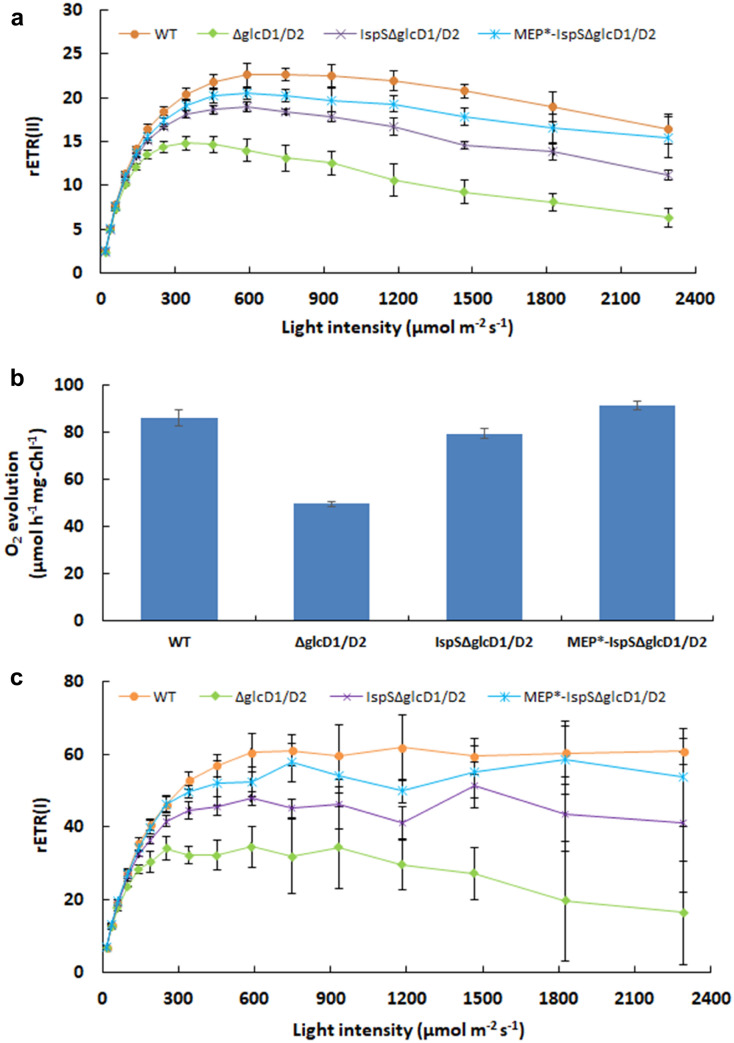
Fig. 4.
Analysis of PSII and PSI activity. a Light response curve of rETR(II), the relative electron transport rate of PSII. b O2 evolution rate under 300 μmol photons m−2 s−1. c Light response curve of rETR(I), the relative electron transport rate of PSI. The cells grown under HC and measurements were done at LC conditions. Error bars indicate standard deviations (SD) of the data from three independent experiments. For each experiment, three technical replicates were performed

