Fig. 5.
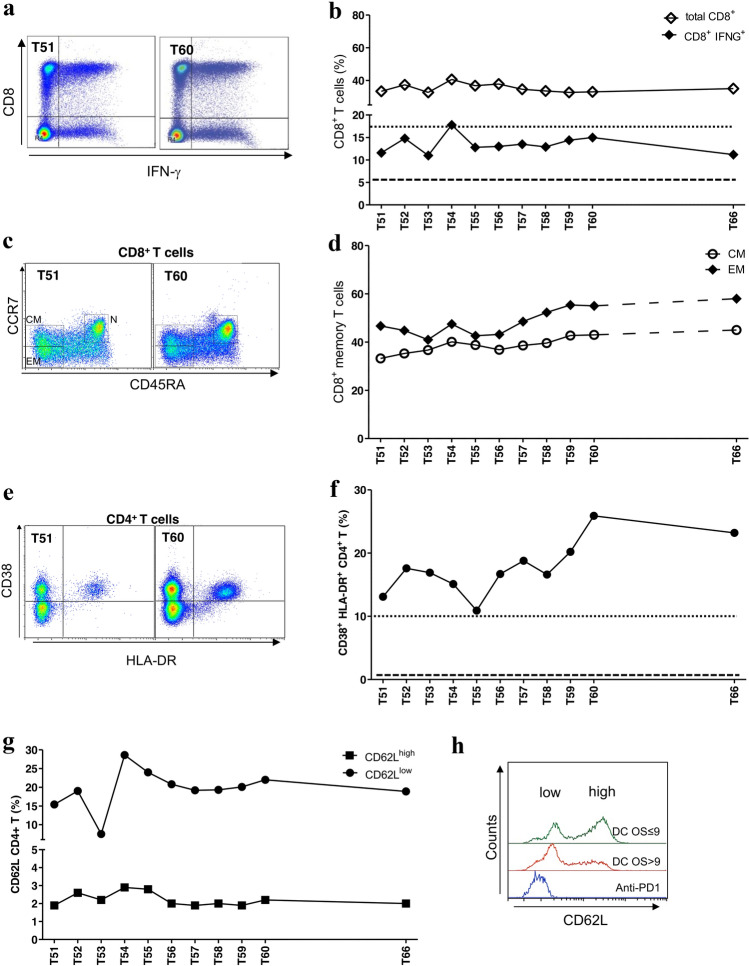
Immune monitoring of the peripheral immune response activated by the anti-PD1 therapy. a Representative dot plots showing the CD8 + T-cell positivity for IFN-γ at two different time points (Time 51 and Time 60) in anti-PD1-treated patient. b Kinetics of the frequency of CD3 + CD8 + T cells (white square) and CD8 + T cells expressing IFN-γ (black square) assessed by flow cytometry. The dotted and dashed lines represent the median of the CD8 + T-cell activation evaluated by IFN-γ expression in V-DENDR2 OS > 9 and OS ≤ 9, respectively. c Representative dot plots showing the memory CD8 + T-cell subsets at two different time points. CM central memory, EM effector memory, N naïve. d Time course of the frequency of CD8 + central (CM) and effector memory (EM). e Representative dot plots showing the double positive CD38 and HLA-DR cells at two different time points. f Kinetics of the frequency of CD38+/HLA-DR+-activated cells evaluated in CD45/CD3/CD4+ T cells. The dotted and dashed lines represent the median of the CD8 + T-cell activation evaluated by IFN-γ expression in V-DENDR2 OS > 9 and OS ≤ 9, respectively. g Kinetics of the frequency of CD4 + T cells expressing CD62L as low and high in anti-PD1-treated patient. h Flow cytometry histogram showing the distribution of the CD62L levels in anti-PD1-treated patient compared to control patients (DC OS ≤ 9 and DC OS > 9)

