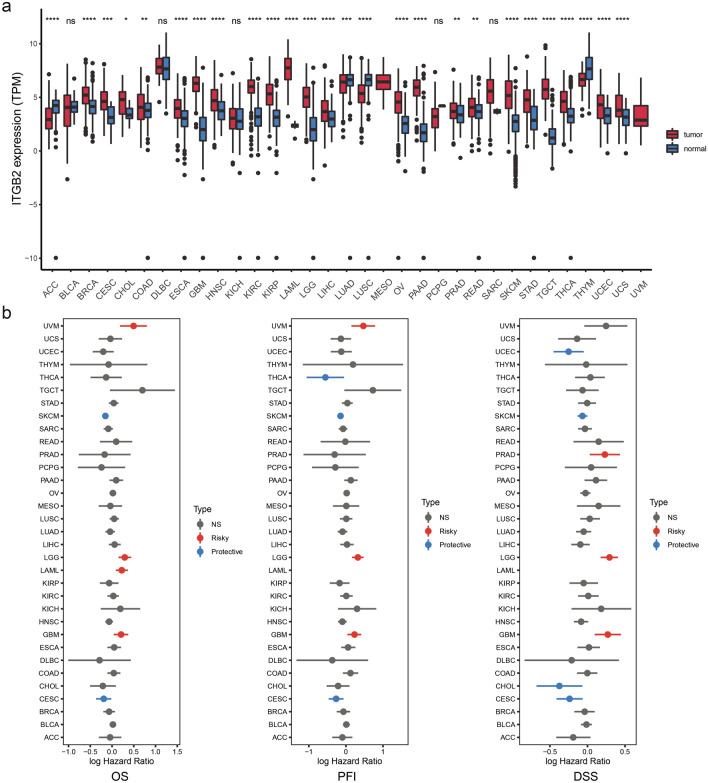
Fig. 1.
Pan-cancer analysis of ITGB2 expression. a UCSCXenaShiny was used to visualize ITGB2 mRNA expression in the cancer genome atlas (TCGA) pan-cancer datasets. *, P < 0.05; * *, P < 0.01; * * *, P < 0.001; * * * *, P < 0.0001, ns = no significance (Wilcoxon test). b Risk plot of correlation between ITGB2 with OS, PFI, DSS (red represents HR > 1 (risky) and P value < 0.05; blue represents HR < 1 (protective) and P value < 0.05; gray represents no significance with P value > 0.05)

