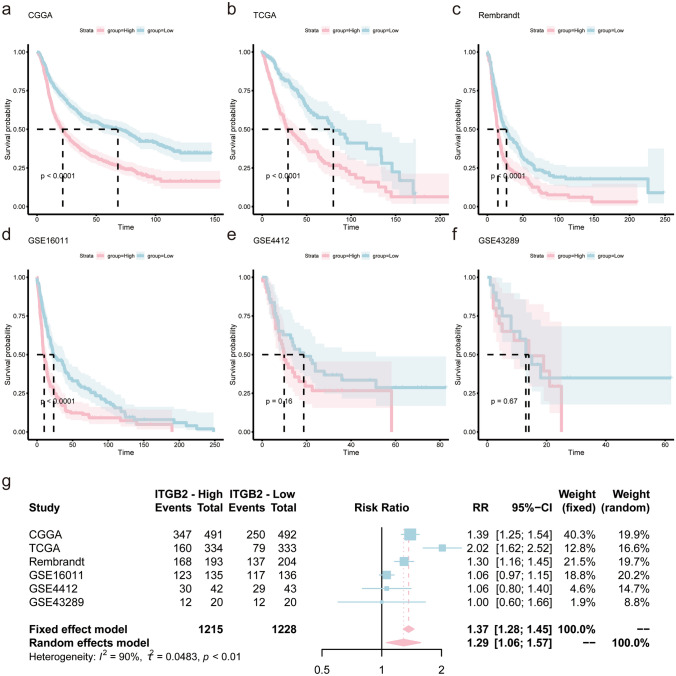
Fig. 2.
High expression of ITGB2 infers a poor prognosis for glioma. Kaplan–Meier plots of ITGB2 in six glioma datasets, 95% CI (confidence interval) were also showed. Patients were divided into high and low expressed group by the medium expression level. a CGGA, b TCGA, c Rembrandt, d GSE4412, e GSE43289, and f GSE16011. g Forest plot of the RRs for patients with high ITGB2 expression compared to patients with low ITGB2 expression

