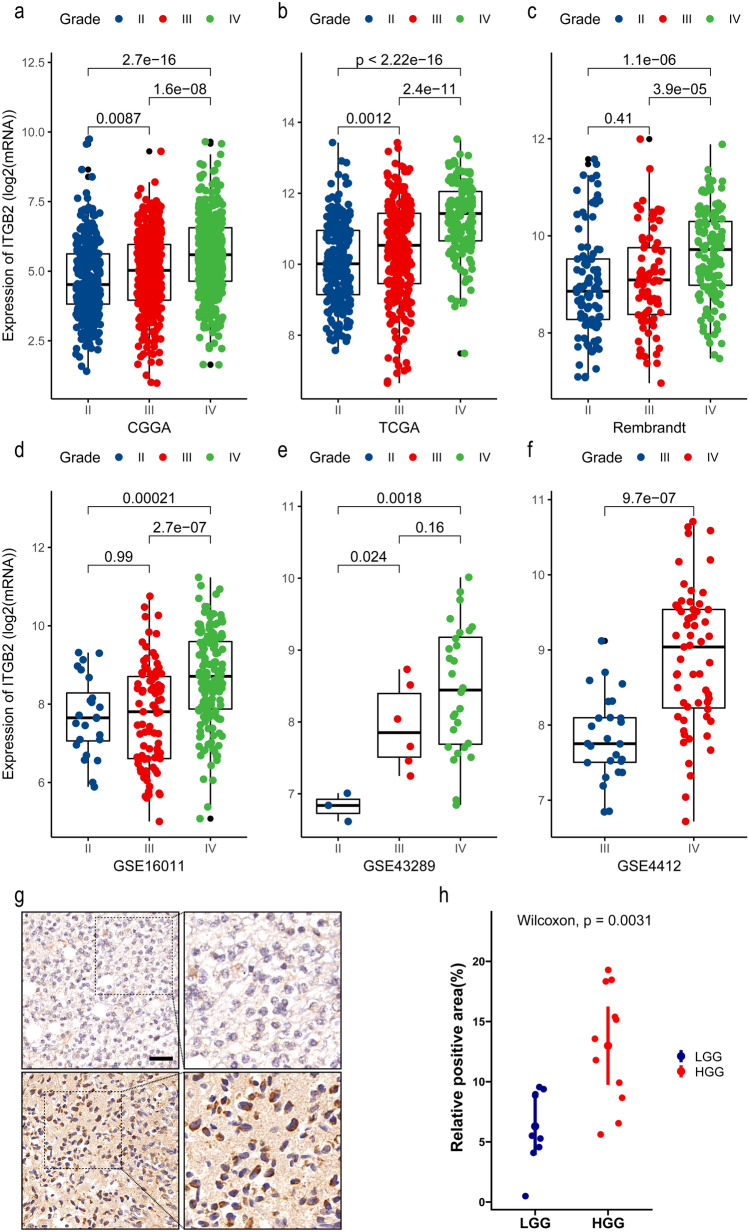
Fig. 4.
The expression level of ITGB2 increased with the progression of gliomas. The X-axis represents the WHO grade, and the Y-axis represents ITGB2 expression values (log2). Based on Wilcoxon test. a CGGA, b TCGA, c Rembrandt, d GSE16011, e GSE43289, and f GSE4412. g Representations (left) and quantification of immunohistochemistry (right) positive areas of ITGB2 in low-grade glioma (LGG) and high-grade glioma (HGG)

