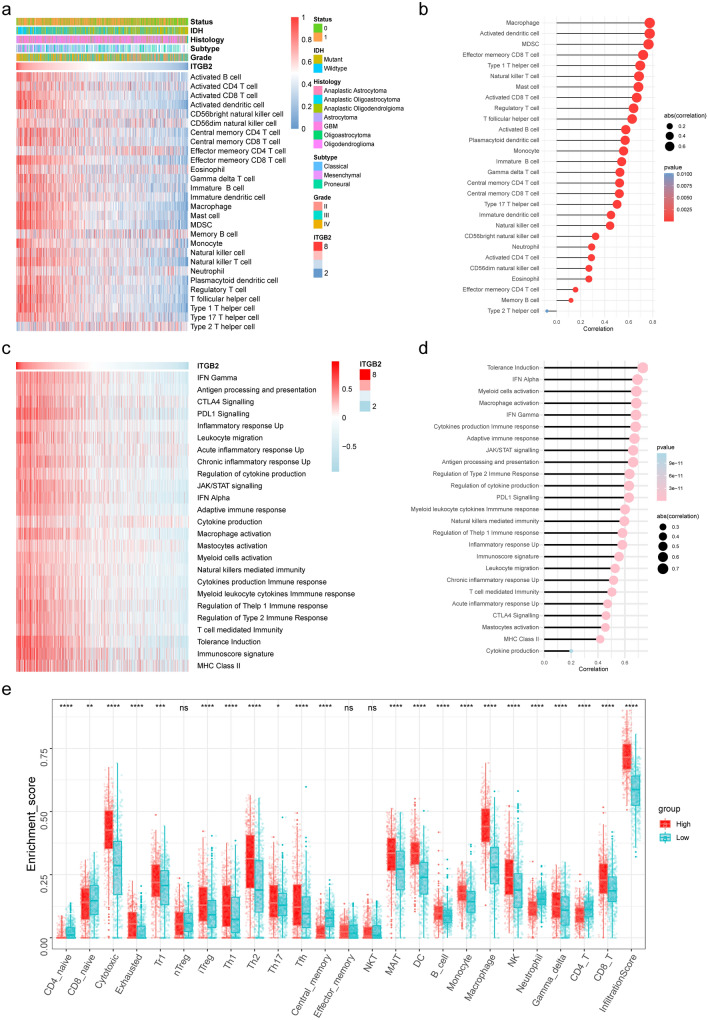
Fig. 5.
ITGB2 is associated with immune infiltration and immune activation in gliomas. a Heatmap showing ITGB2-associated relative abundance of 28 immune cells in gliomas, annotations show corresponding clinical features of each sample. b The correlation between the ssGSEA scores of 28 immune cells and the expression of ITGB2 in gliomas. c Heatmap showing ITGB2-associated GSVA scores of 25 innate and adaptive immunity-related gene sets. d The correlation between the GSVA scores of 25 innate and adaptive immunity-related gene sets and the expression of ITGB2 in gliomas. e The fraction of TILCs in ITGB2 high and low subgroups. Within each group, the scattered dots represent TILCs expression values. The thick line represents the median value. The bottom and top of the boxes are the 25th and 75th percentiles, interquartile range. The statistical difference of two subgroups was compared through the Kruskal–Wallis test

