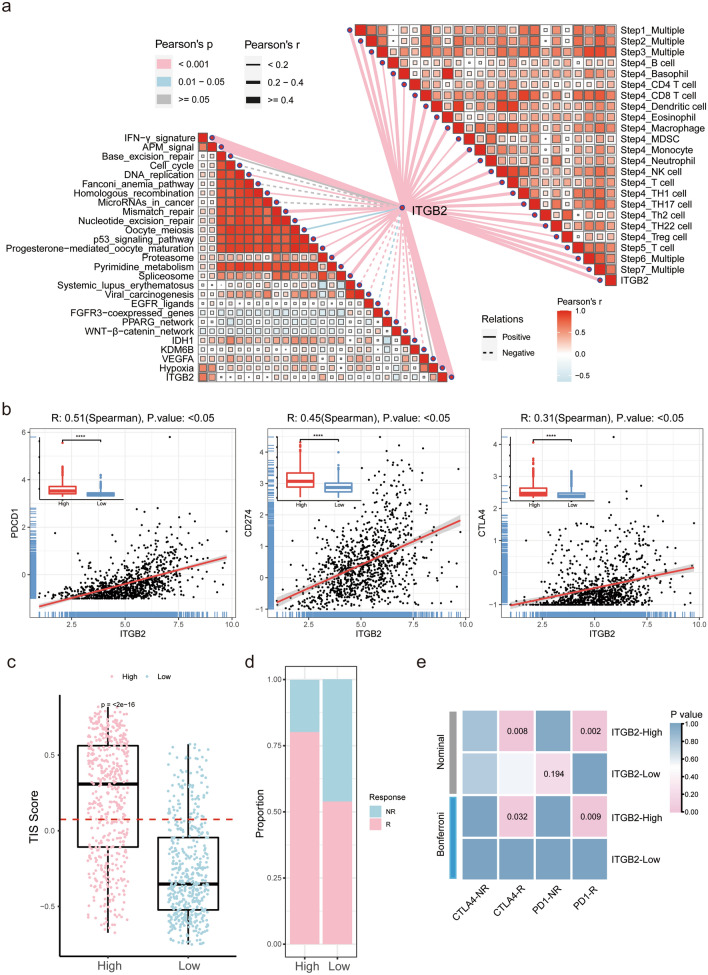
Fig. 6.
Correlation between ITGB2 and immune phenotypes and TIICs of gliomas and ITGB2’s potential in predicting immunotherapy responses of gliomas. a (Top right) Correlations between ITGB2 and the steps of the cancer immunity cycle. (Bottom left) Correlations between ITGB2 and the enrichment scores of immunotherapy-predicted pathways. b The correlation between the expression of ITGB2 and PDCD1 (PD-1), CD274 (PDL-1) and CTLA4 in CGGA cohort. c T-cell inflammatory signature (TIS) scores across ITGB2 subgroups. A point presents a single glioma sample. Red line indicates the median value. d Rates of the different anti-PD1 and anti-CTLA4 responses of patients from the CGGA cohort predicted by the ImmunCellAI in the high or low ITGB2 subgroups. e SubMap analysis revealed that ITGB2-high subgroup could be more sensitive to immunotherapy (Bonferroni corrected P value < 0.05)

