Fig. 1.
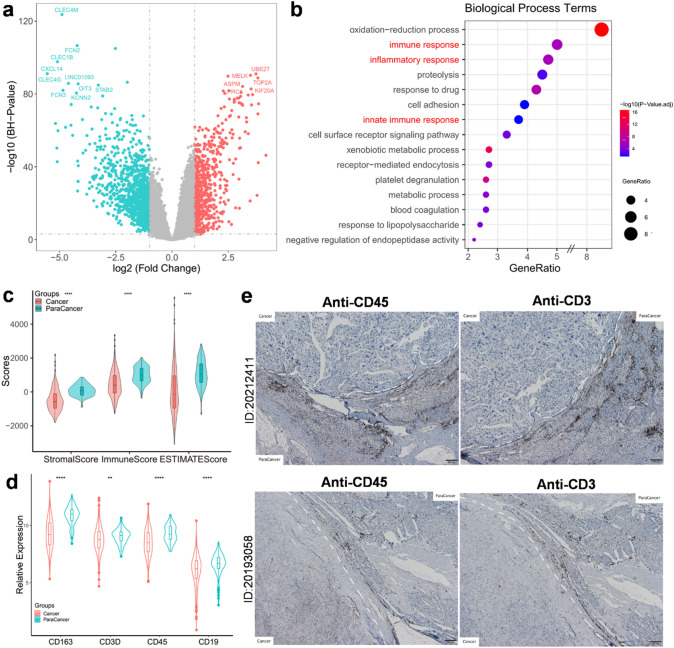
Immune cells converged in paracancer versus cancer tissues. a Volcano plots of DEGs in GEO array dataset, top DEGs (−log10(BH p-value) > 80, |log2FC| > 2.5) were labeled. Red dots represented upregulated genes in cancer tissues, while green dots represented upregulated genes in paracancer tissues. b Bubble plots of top 15 biological process terms of GO annotation which were ordered by gene ratio of enriched process (p < 0.01). c Stomal scores and immune scores (inferred by ESTIMATE) in paracancer and cancer tissues plotted by violin box plots (p < 0.001). d Expression of CD163, CD3, CD45, and CD19 in paracancer versus cancer tissues (p < 0.01). e Immunohistochemistry of CD45 and CD3 in paracancer and cancer tissues from two independent HCC patients

