Fig. 2.
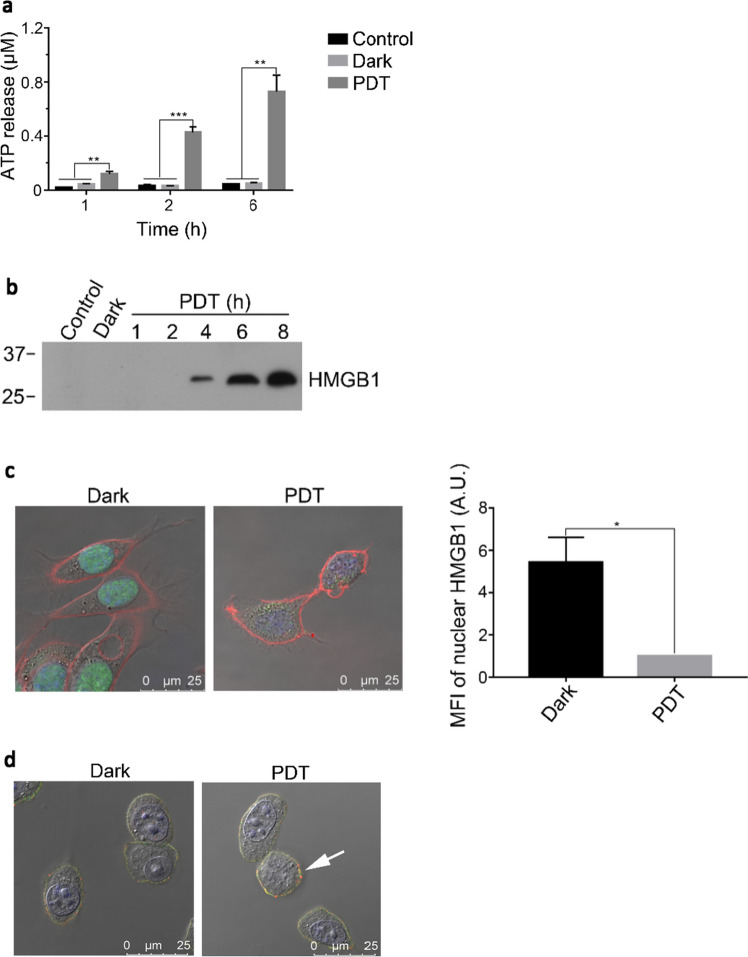
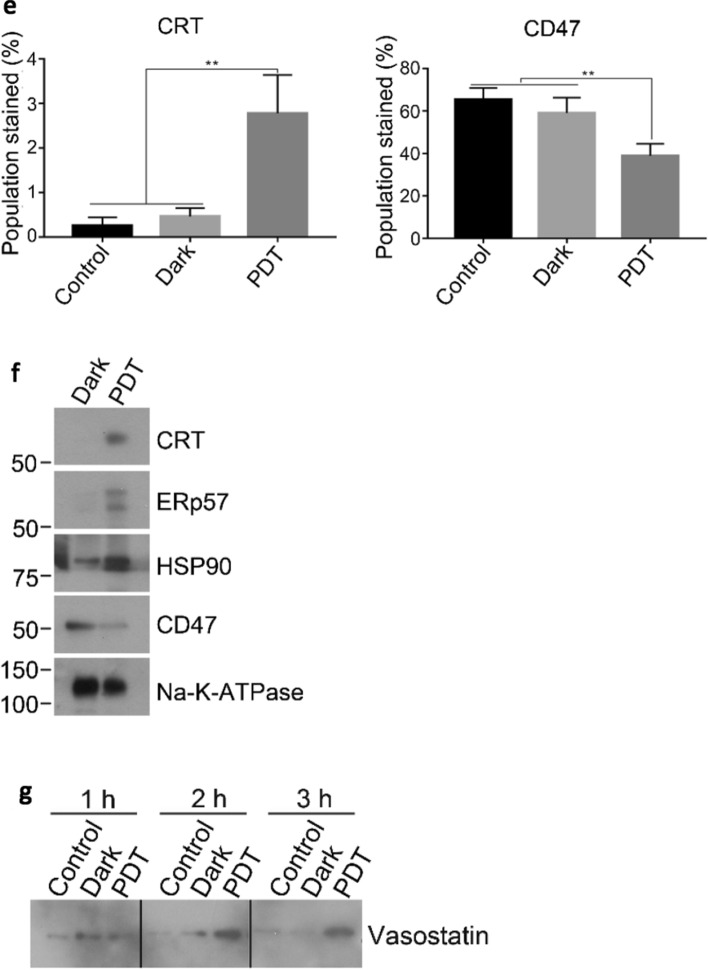
BAM-SiPc-PDT induced the exposure and release of DAMPs. CT26 cells were first treated with 4 nM BAM-SiPc before different experiments were carried out. a, b The PDT-treated cells were incubated for various time periods before the culture supernatants were collected for the detection of a ATP (luminescence assay) and b HMGB1 (Western blot analysis). c The PDT-treated cells were incubated for 2 h before being observed under a confocal microscope. Cell membrane, nucleus and HMGB1 are shown in red, blue and green, respectively. The graph shows the mean fluorescence intensity (MFI) of HMGB1 in the nucleus. d The PDT- treated cells were incubated for 1 h. CRT the cell surface CD44 are shown in red and green respectively. The white arrow indicates the location of CRT. e The PDT-treated cells were incubated for 4 h and then stained with PI together with anti-CRT or anti-CD47 antibody for flow cytometric analysis. The population stained was firstly gated for cells of PI negative and displayed the corresponding antibody stained positive cells. f Cell membrane proteins were collected from the PDT-treated cells for Western blot analysis of the indicated proteins, with Na–K-ATPase serving as loading control. g Proteins in the culture supernatant of the PDT-treated cells were collected at various times, concentrated and probed for vasostatin in Western blot analysis. Data shown are means ± SEM or representative results of three independent experiments. *p < 0.05, **p < 0.01, ***p < 0.001


