Fig. 2.
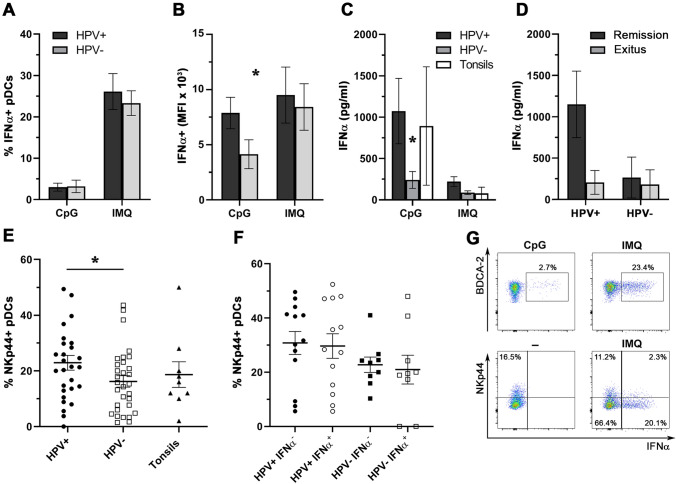
Differences in IFNα production and NKp44 expression in pDCs infiltrating HPV+ and HPV− HNSCC samples. Columns represent a the mean proportions of tumor-infiltrating IFNα-producing pDCs upon stimulation with CpG ODN 2216 (CpG; 20 µg/ml, 5 h) or imiquimod (IMQ; 5 µg/ml, 5 h); b the mean fluorescence intensity (MFI) of IFNα+ pDCs upon stimulation with CpG or IMQ; and c the mean concentration of IFNα in tissue-derived cell culture supernatants derived from HPV-positive HNSCC (n = 16), HPV-negative HNSCC (n = 14) and control tonsils (n = 4) after 24 h of stimulation with CpG or IMQ. All error bars indicate SEM. d Columns show differences in CpG-induced IFNα production in cell culture supernatants obtained from HPV+ and HPV− tumor samples with respect to patient overall survival. e Dot plot showing proportions of NKp44+ pDCs derived from HPV+ HNSCC (n = 28), HPV− HNSCC (n = 31) and age-matched control tonsils (n = 9). Each symbol represents a patient, the horizontal line represents the average, and error bars indicate SEM. f Dot plot showing proportions of IMQ-stimulated IFNα+ pDCs derived from HPV+ HNSCC (n = 13) and HPV− HNSCC (n = 9) in relation to NKp44 expression. The horizontal line represents the average, and error bars indicate SEM. g Dot plots showing the production of IFNα and expression of NKp44 in a representative patient. *p < 0.05

