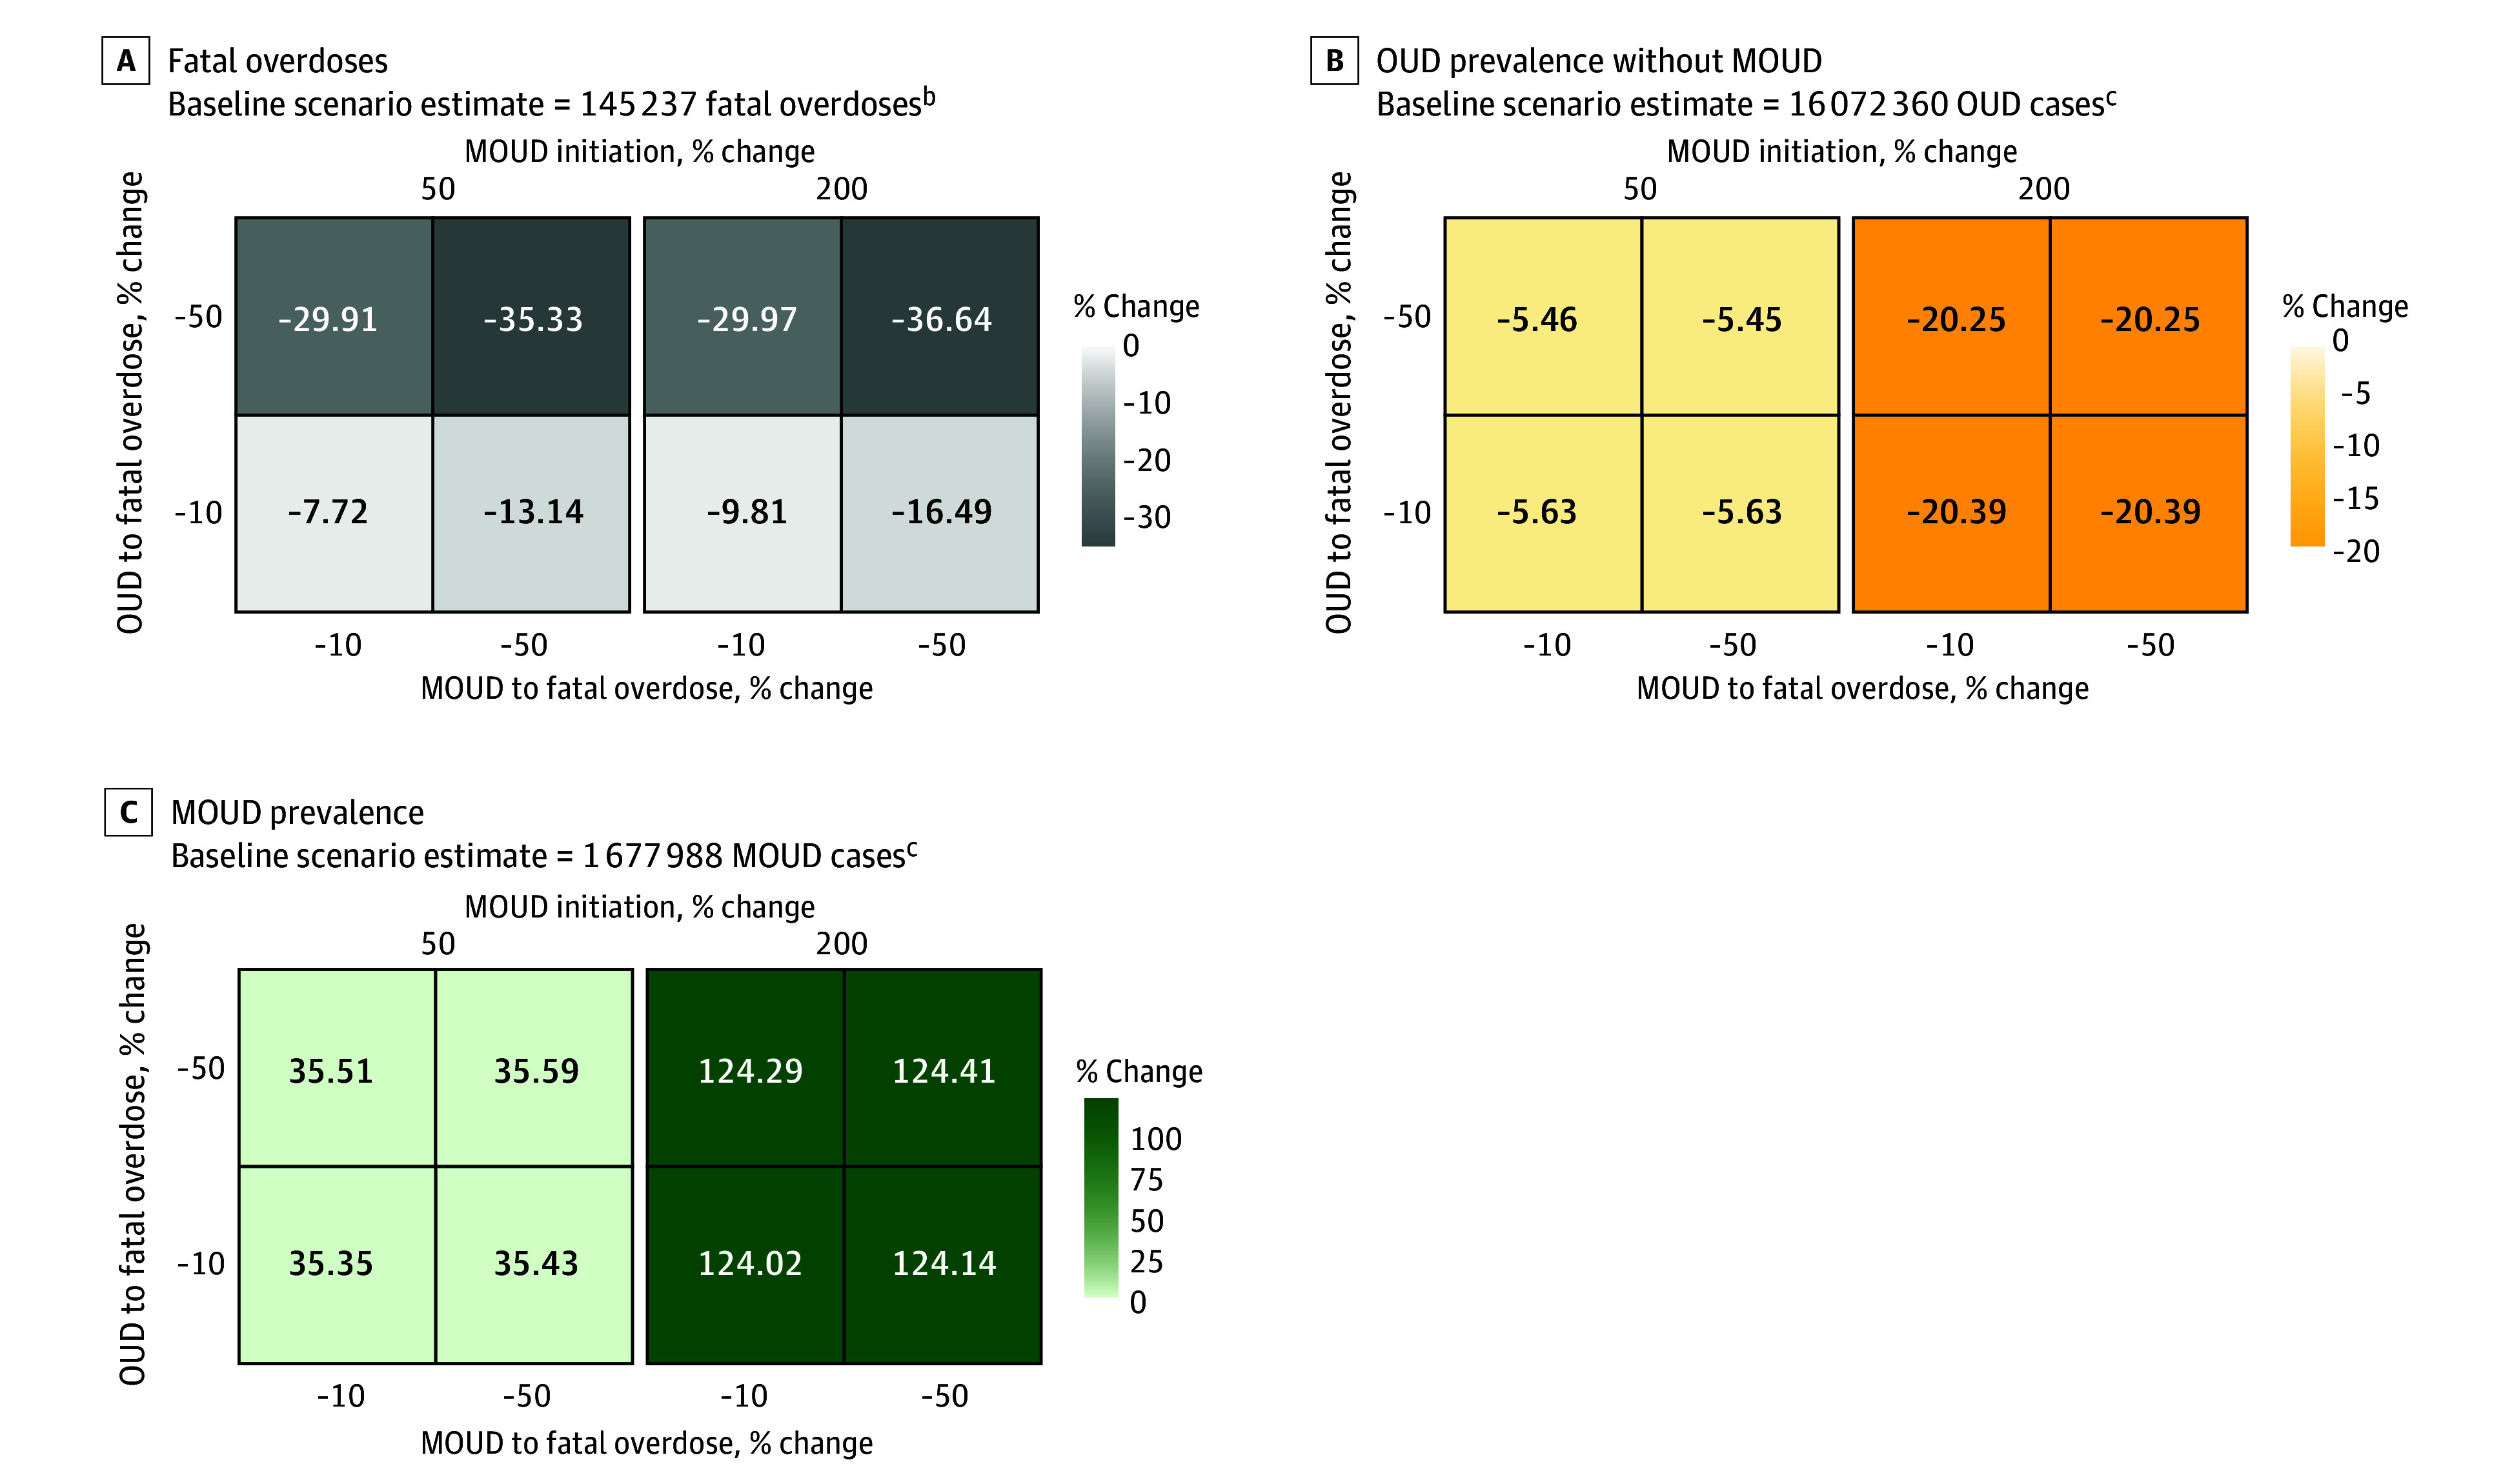
Figure 5. Percentage Change in Projected Model Outcomes Relative to the Baseline Scenario for Fatal Overdoses, Opioid Use Disorder (OUD) Prevalence Without Medications for Opioid Use Disorder (MOUD), and MOUD Prevalence Under Model Scenario Da.

aDecreased fatal overdoses and increased MOUD initiation.
bModel estimates are cumulative over the time horizon of simulated public health interventions (January 1, 2021, to December 31, 2023).
cModel estimates indicate prevalence at the end of the simulation (December 31, 2023).
