
12.
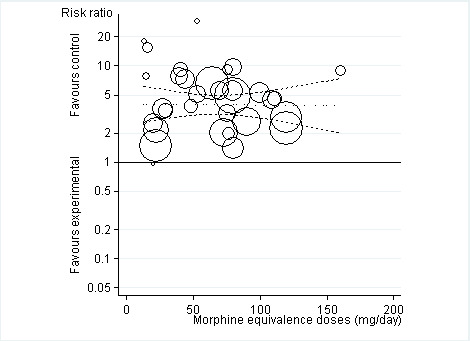
Risk ratios of participants withdrawn or dropped out because of adverse events between opioids and control groups (y axis) are plotted against total daily dose of morphine equivalents (x axis). The size of the circles is proportional to the random‐effects weights that were used in the meta‐regression. The dotted line indicates predicted treatment effects (regression line) from univariable meta‐regression by using daily morphine equivalence doses the explanatory variable, and dashed lines represent the 95% confidence intervals.