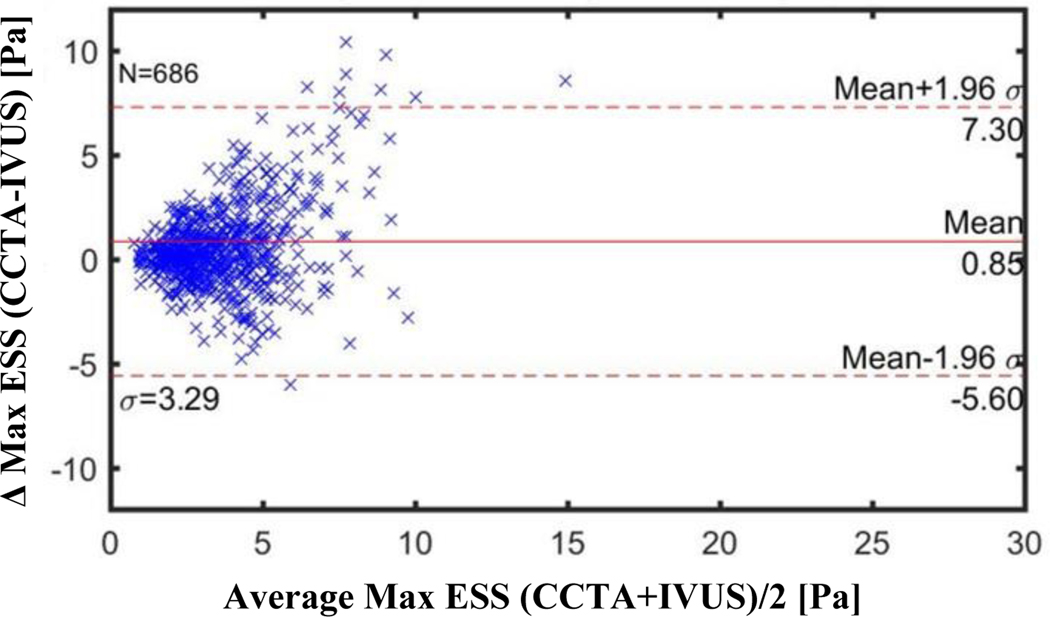
Figure 4: Bland-Altman Plots of Maximal ESS by CCTA vs by IVUS for All CCTA Methods (Combined 256-slice method and 64-slice methods).
CCTA= coronary computed tomography angiography
IVUS=intravascular ultrasound
Each marker (N=686) corresponds to average value over ~0.3 mm thick sub segment
Mean difference: Combined 256+64-slice CCTA: −0.85 Pa (CI −1.094 to −0.601)
256-slice CCTA: −0.52 Pa (CI −0.759 to −0.288)
64-slice CCTA: −1.15 Pa (CI −1.579 to −0.731)

