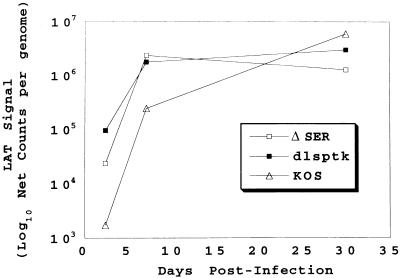
FIG. 6.
LAT expression per genome during acute and latent infection. The 56-h- and 7-day-postinfection LAT RT-PCR and viral DNA PCR data from Fig. 4 were combined with the corresponding 30-day-postinfection LAT RT-PCR and viral DNA PCR data to illustrate LAT expression per genome as a function of time. As the absolute amount of LAT was not quantitatively determined with standards, the LAT RT-PCR signal per genome is represented simply as net counts per genome.

