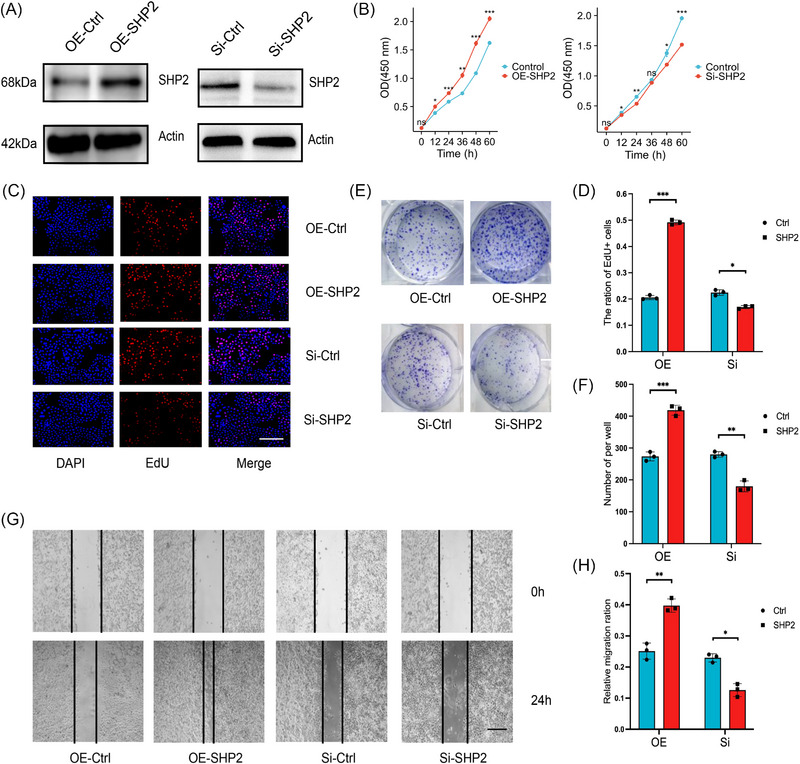
FIGURE 2.

The relationship between SHP2 and malignant biological behavior in gastric cancer. (A) WB analysis of the expression of SHP2 in HGC‐27 cells in the different treated groups. (B) The CCK8 proliferation assay of HGC‐27 cells with SHP2 overexpression or silence. (C) The HGC‐27 cells were stained with EdU, and then the EdU positive cells were counted to evaluate the proliferation of GC cells. scale bar = 200 µm. (D) Quantitative analysis of (C) (n = 3). (E) The effect of SHP2 expression level on the proliferation in HGC‐27 cells was determined by clone formation assay. (F) Quantitative analysis of (E) (n = 3). (G) The migratory capacity of HGC‐27 cells was tested in a scratch assay. scale bar = 50 µm. (H) Quantitative analysis of (I) (n = 3). *p < 0.05; **p < 0.01; and ***p < 0.001.
