
FIGURE 8.
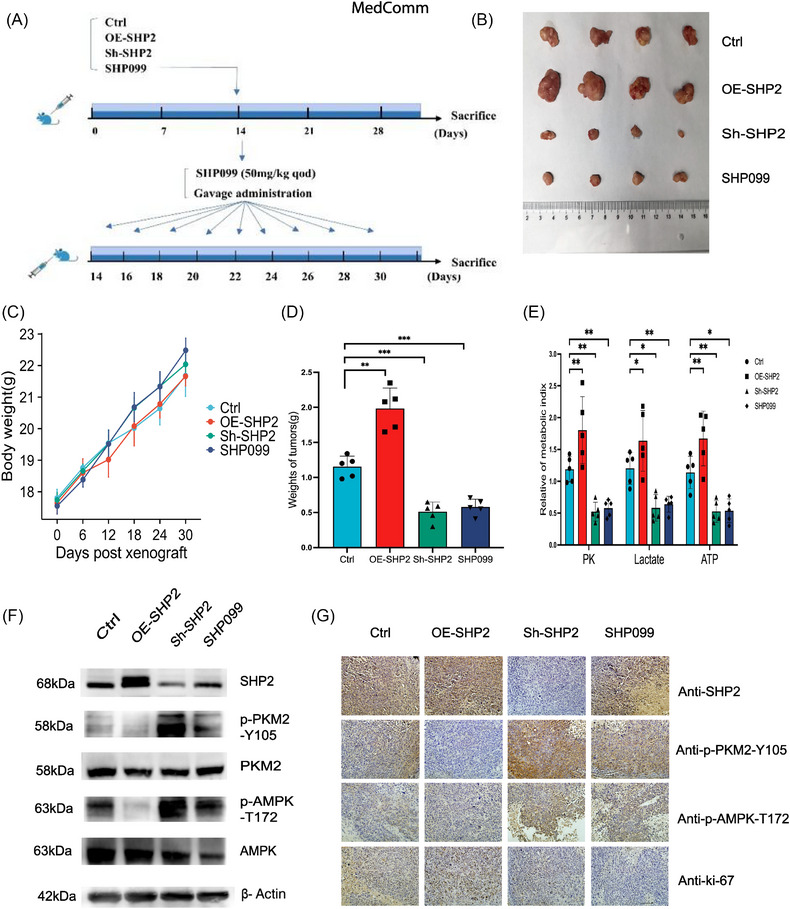
In vivo validation for SHP2/PKM2/AMPK positive feedback loop. (A) The flow charts design for in vivo experiments. The model of mice was created with BioRender.com. (B) Morphology and size of xenografted tumors in mice after sacrifice. (C) The body weight of mice in different groups. (D) Quantitative analysis the weight of tumors (n = 5). (E) The quantitative analysis of metabolic index of tumor tissues in different groups. (F) WB quantification of the expression of SHP2, p‐PKM2, and p‐AMPK in tumors tissues in the different groups. (G) The expression of SHP2, p‐PKM2, p‐AMPK, and Ki‐67 in xenografted tumors tissues obtained from the different groups was evaluated by IHC. *p < 0.05; **p < 0.01; and ***p < 0.001.