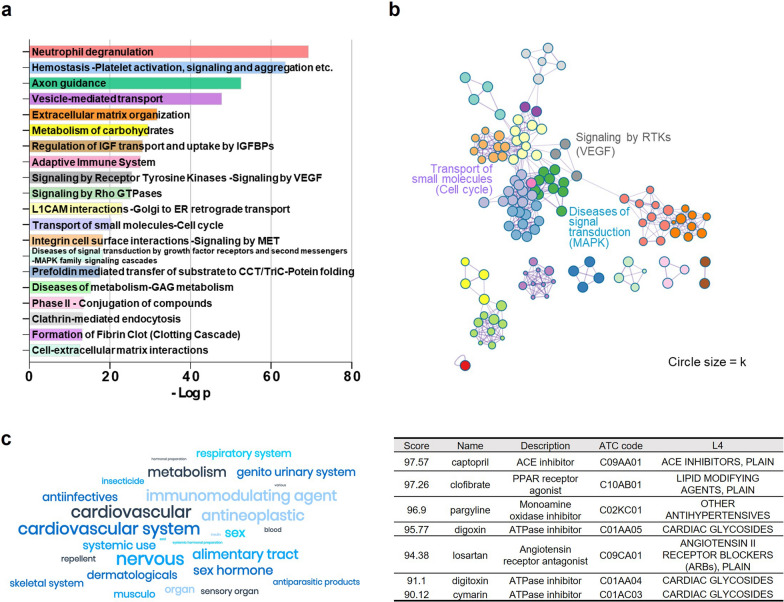
Fig. 5.
Proteomic analysis and functional enrichment of HA-iMSC-EV proteins. a Top 20 enriched pathways and process terms of HA-iMSC-EVs. The bar graph represents -log10(p-value). b Clustering analysis of angiogenesis, cell cycle, and MAPK signal transduction. Pathways were clustered at a minimum overlap of 3, p = 0.01, and a minimum enrichment of 1.5. The colors of the nodes matched the colors of each pathway, as shown in (a). c Connectivity map analysis of HA-iMSC-EV proteins. The potential indications for HA-iMSC-EVs classified according to the ATP level 1 classification were implemented as a word cloud (left). The cardiovascular drugs with the highest connectivity scores to HA-iMSC-EVs are listed in Table (right)

