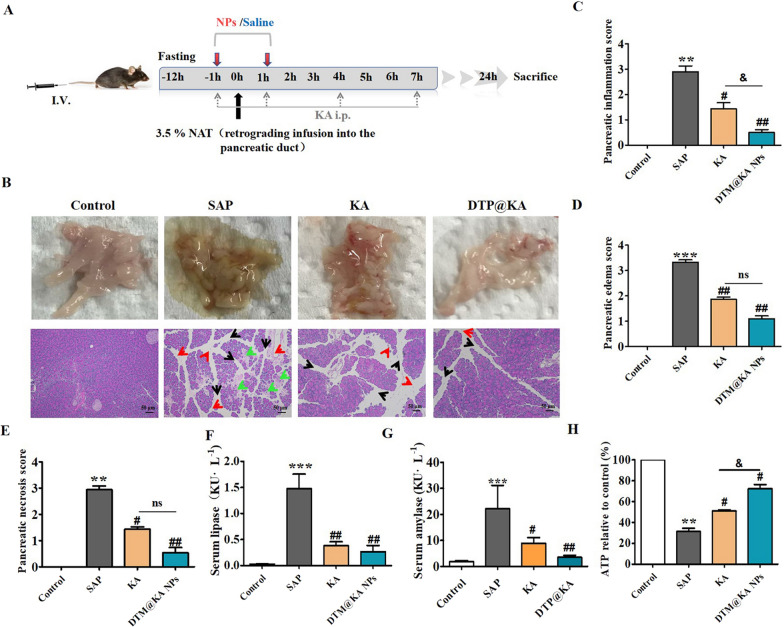
Fig. 4.
DTP@KA NPs was protective in experimental SAP. A. Schematic statement of experimental SAP and intervention protocols. B. Typical pictures of fresh pancreatic tissues and representative H&E images of pancreas. Scar bar = 50 μm. Red arrow, inflammation infiltration; black arrow, edema; green arrow, necrosis. C. Inflammatory injury scores of pancreatic tissues. D. Edema scores of pancreatic tissues. E. Necrosis score of pancreatic tissues. F. Serum lipase levels. G. Serum amylase levels. H ATP contents. Data represent the mean ± SEM of at least three independent experiments; n = 5–8/group. Significance: ** p < 0.01 and *** p < 0.001 vs. the control group; # p < 0.05 and ## p < 0.01 vs. the SAP model group; & p < 0.05 vs. the KA group

