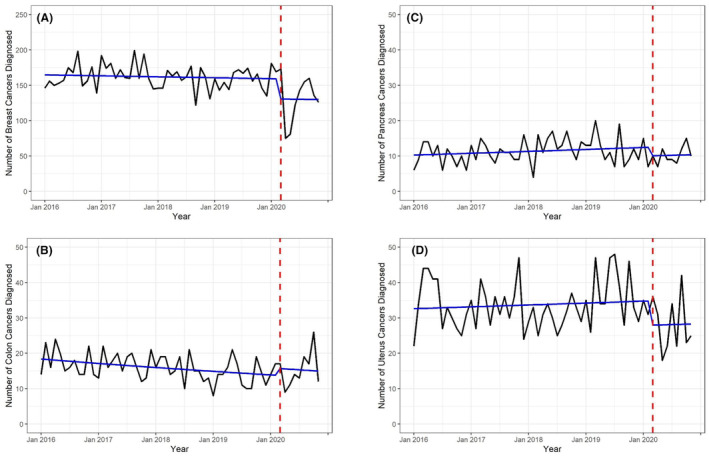
FIGURE 1.

Number of incident cancers diagnosed between January 2016 and November 2020. The y‐axis reflects the total number of individuals diagnosed and the x‐axis reflects the time between January 2016 and November 2020. Raw case counts are shown in black and model‐based predicted case counts are shown in blue. The red dashed vertical line marks March 2020, representing the onset of the COVID‐19 pandemic in the US. (A) breast cancer, (B) colon cancer, (C) pancreatic cancer, (D) uterine cancer.
