Figure 4:
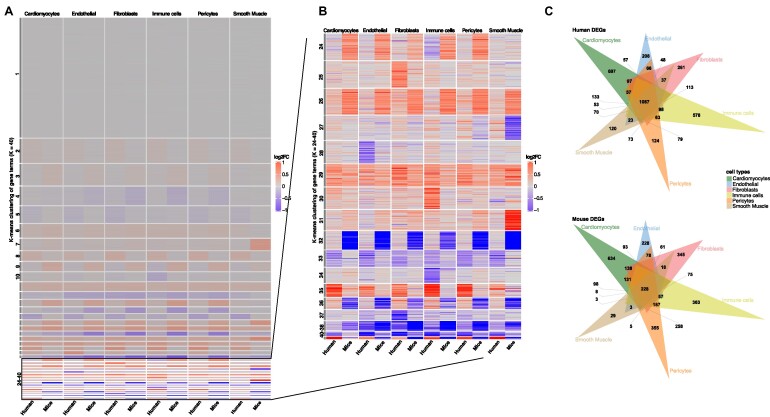
DEG analysis shows similar and different populations of regulation in gene expression patterns upon heart failure in humans and mice. (A) Heatmap of log2FC values (control vs HFrEF) for all genes and all cell types. The y-axis describes all genes (16,545) clustered by a k-means algorithm (k = 40). The x-axis shows the species and the additional clustering into the different cell types. Positive log2FCs are represented by red, while negative scores are given in blue. (B) Closeup of the 24–40 k-means clusters of log2FCs of genes in which most cell type–specific differences are observed. (C) Venn diagrams of all identified DEGs in human (top) and mouse (bottom) (log2FC > 0.1 and P-adjusted < 0.05).

