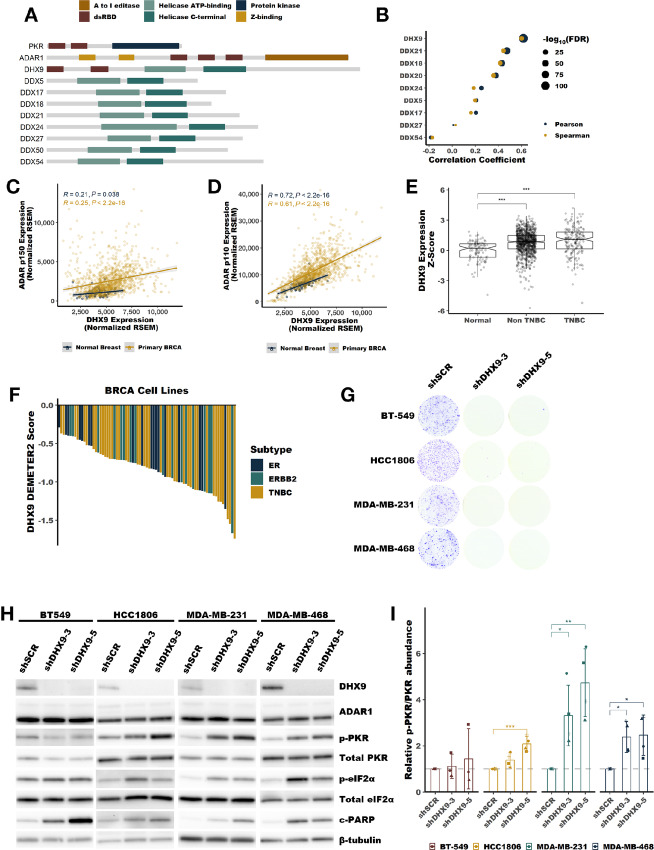
FIGURE 3.
DHX9 is overexpressed in breast cancer and suppresses PKR activation. A, Schematic showing the domain structure of PKR, ADAR1, DHX9 and other helicases identified by proximity labeling in Fig. 1, dsRBD refers to the dsRNA binding domain. B, Pearson and Spearman correlation coefficients for the correlation between ADAR1 expression at the RNA level and the expression of each indicated helicase at the RNA level, data from breast tumors within TCGA. Scatterplots showing the correlation between ADAR1-p110 (C), or ADAR1-p150 (D), and DHX9 expression in normal breast or breast tumors. E, Expression of DHX9 at the RNA level in normal breast, non-TNBC or TNBC tumors. F, Waterfall plot showing DHX9 dependency of breast cancer cell lines using data from DepMap, ER = estrogen receptor–positive cell lines, ERRB2 = HER2-positive cell lines. G, Foci formation assay following knockdown of DHX9 with two different shRNAs in four TNBC cell lines. Cells were plated for foci formation 2 days after transduction and foci were stained after 10 days. G, Representative immunoblot following knockdown of DHX9 with two different shRNAs in four TNBC cell lines, same cells as used in G. Protein lysates were collected from cells 4 days after transduction with lentivirus encoding the shRNAs listed. Immunoblots for other replicates and uncropped blots can be found in Source Data Figures. I, Quantification of PKR phosphorylation as determined by the immunoblot in H. Quantification of protein expression for other proteins of interest can be found in Supplementary Fig. S4A–S4E. Bars represent the average of at least three replicates, error bars are ± SD. *, P < 0.05; **, P < 0.01; ***, P < 0.001. P values determined by Dunnett test.

