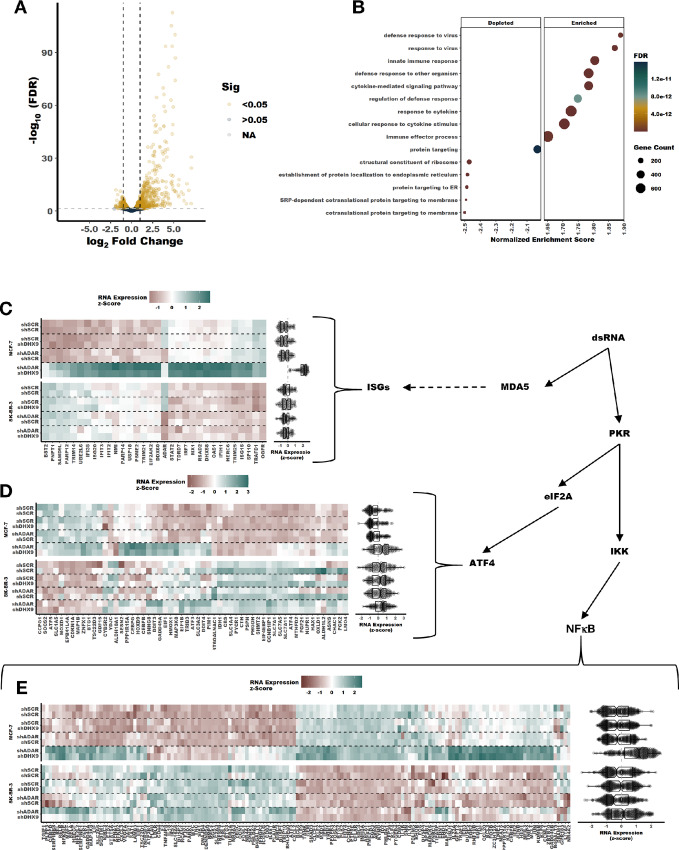
FIGURE 5.
Induction of a viral mimicry phenotype upon knockdown of DHX9 and ADAR1 in MCF-7. A, Volcano plot showing changes in RNA expression upon knockdown of DHX9 and ADAR1 in MCF-7, a volcano plot for SK-BR-3 is in Supplementary Fig. S6F. RNA was isolated from cells 5 days after transduction with the shRNAs listed. Fold change of RNA expression shown in A was determined using an interaction term between ADAR1 and DHX9 knockdown, volcano plots for fold change of RNA expression for single knockdown of ADAR1 or DHX9 is in Supplementary Fig. S6A–S6B and S6D–S6E. B, GO terms identified by gene set enrichment analysis of the RNA-seq data in A. C–E, Heat maps and summary box plots showing RNA expression changes in MCF-7 and SK-BR-3 upon knockdown of ADAR1 and/or DHX9. C shows RNA expression for core ISGs (22, 35), D shows ATF4 targets, and E shows NFκB targets with ISGs removed. Genes are clustered by RNA expression across all four samples. Clustering was performed for each gene set (ISGs, ATF4 targets, or NFκB targets) independently. For more information, see GitHub repository link in Data and Code Availability.

