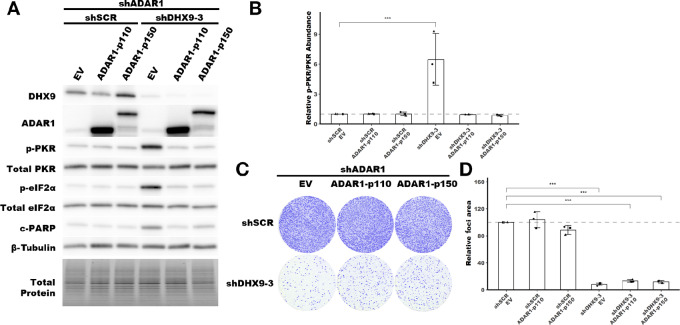
FIGURE 8.
Rescue of PKR activation by ADAR1-p110 and ADAR-p150. A, Representative immunoblot showing the phenotype of ADAR1 and DHX9 knockdown with ADAR1-p110 or ADAR1-p150 overexpression in SK-BR-3. Immunoblots for other replicates and uncropped blots can be found in Source Data Figures. B, Fold change of PKR phosphorylation at Thr-446 upon ADAR1 and DHX9 knockdown with ADAR1 isoform overexpression, quantified from immunoblots in A. C, Representative foci formation phenotype of ADAR1 and DHX9 knockdown ADAR1 isoform overexpression. Quantification of relative foci area is shown in D. Quantification of protein expression for other proteins of interest can be found in Supplementary Fig. S11A–S11F. Timepoints for collecting protein lysates and foci formation are the same as described in Fig. 4 for SK-BR-3. Bars represent the average of at least three replicates, error bars are ± SD. ***, P < 0.001. P values determined by Dunnett test.

