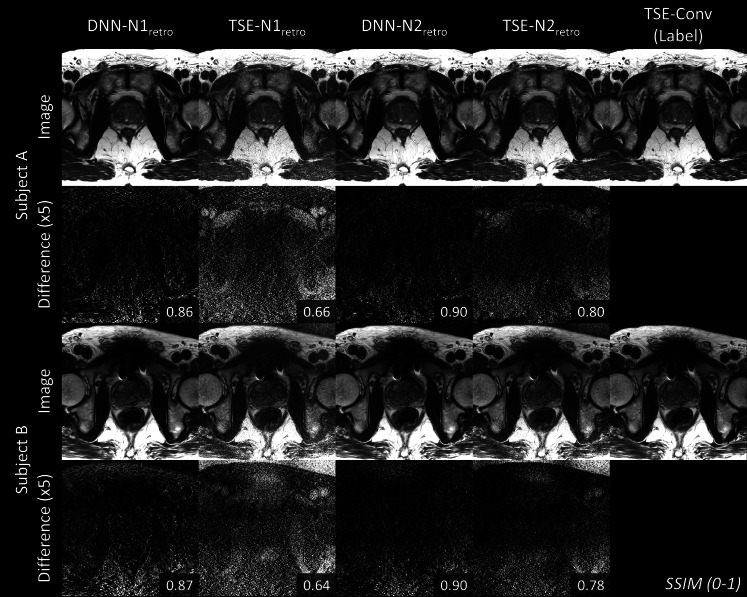
Figure 3.
Reconstructed images of two representative subjects in the retrospective test data set are displayed. DNN-N1retro, TSE-N1retro, DNN-N2retro and TSE-N2retro images are shown with TSE-Conv images as references (last column). The second and fourth rows display the difference map with the label. For visualization, the difference maps were multiplied by 5. SSIM is reported in the right corner of each difference map. DNN shows higher SSIM than TSE on the retrospective undersampled data. DNN, deep neural network; SSIM, structure similarity index; TSE, turbo spin echo.

