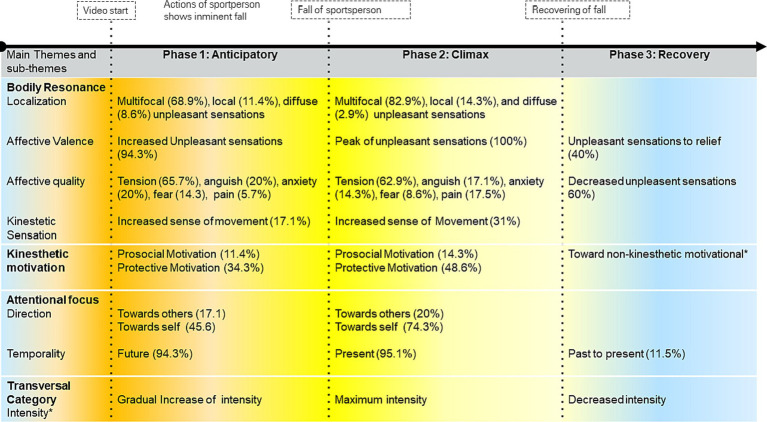
Figure 5.
Temporal structure of empathy for pain. The arrow at the top of the figure indicates the time evolution of the experience. The dotted lines show the points of change from one phase to the next phase. Above the arrow are shown the video’s events concerning the participants in each phase. The cross intensity refers to the category that characterizes each phase. This category is integrated with the video moments perceived by the participants to define each phase. The asterisk (*) indicates an emergent category following refinement of the temporal structure, previously described as none. The color shows the temporal flow of intensity from gradual increase (orange), to climax (yellow), and then decrease (blue). The % represents the percentage of the total sample in the category.

