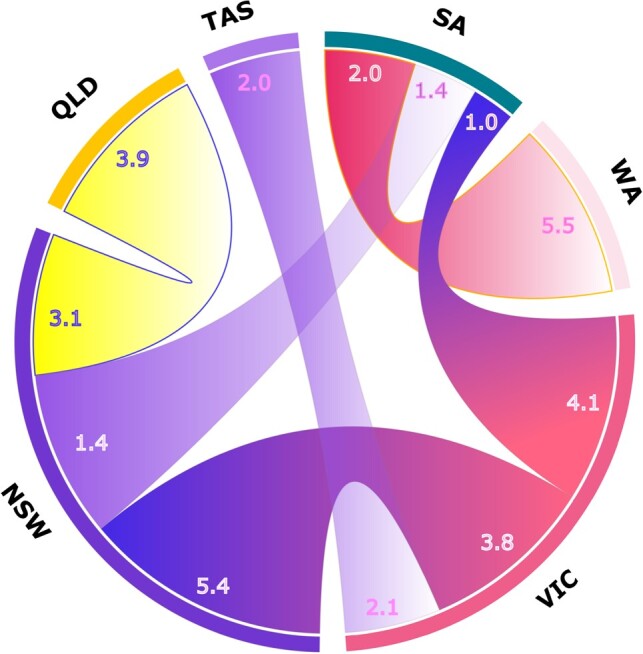
Fig. 6.

The representation of interconnectors between regions and the amount of energy exported in TWh. The value next to the region indicates the amount of energy exported to another region via the interconnection. The thickness of each chord also reflects the amount of exported energy.
