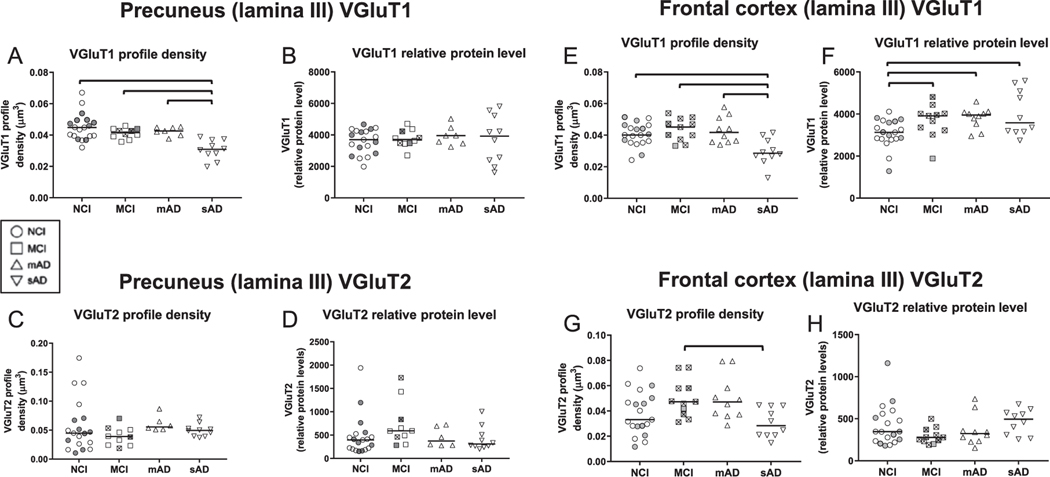
Fig. 2.
Quantitative measures of vesicular glutamate transporter 1 (VGluT1) immunoreactive profile densities (precuneus, A; frontal cortex, E) and relative protein levels (intensity) (precuneus, B; frontal cortex, F) and vesicular glutamate transporter 2 (VGluT2) immunoreactive profile densities (precuneus, C; frontal cortex, G) and relative protein levels (intensity) (precuneus, D; frontal cortex, H) from cases with no cognitive impairment (NCI), mild cognitive impairment (MCI), mild to moderate Alzheimer’s disease AD (mAD) and moderate to severe AD (sAD). In each clinical diagnostic group, cases with a CERAD diagnosis of No AD/Possible AD (“low pathology”) are identified by shaded symbols and cases with CERAD diagnosis of Probable AD/Definite AD (“high pathology”) are identified by empty symbols. Within the MCI groups, symbols for data points of amnestic cases contain the symbol “×”. The single solid line in each plot indicates the median value. Brackets in panel A indicate statistically significant groupwise differences (p < 0.05) determined by the Kruskall-Wallis analysis of variance and Dunn’s multiple comparisons test.

