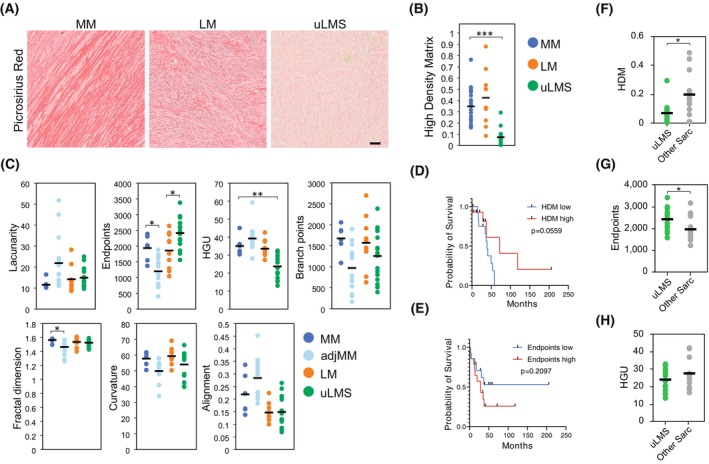
Fig. 1.

uLMS are characterised by low fibrillar collagen density and high fibre endpoints. (A) Representative images of picrosirius red staining of normal myometrium (MM; n = 6), uterine leiomyoma (LM; n = 10) and uterine leiomyosarcoma (uLMS; n = 16) tissues. Scale bar indicates 100 μm. (B) Quantification of the fraction of high‐density matrix (HDM) in tissues from (A). One‐way ANOVA with post hoc Tukey's test. (C) Quantification of morphological aspects of the collagenous matrix based on staining from (A) and including tumour‐adjacent MM (adjMM, < 1 mm from tumour edge; n = 14). HGU (hyphal growth unit). One‐way ANOVA with post hoc Tukey's test. (D, E) Kaplan–Meier curves of uterine sarcoma patients grouped based on their fraction of HDM (D) or number of fibre endpoints (E) (low: n = 14; high: n = 14). Log‐rank test. (F–H), Quantification of HDM (F), fibre endpoints (G), and HGU (H) comparing uLMS tumours (n = 16) and the other sarcomas included in our cohort (other Sarc; n = 12). Two‐tailed Student's t‐test. Each dot in the graphs indicates the average of four measurements per tumour sample; horizontal bar indicates the average of the tissue type. *P < 0.05, **P < 0.01, ***P < 0.001.
