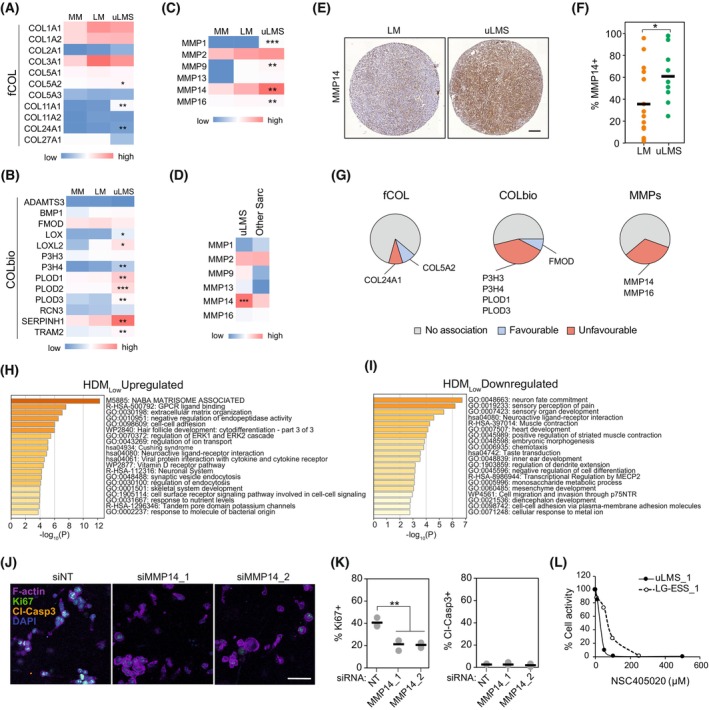
Fig. 2.

uLMS cells highly express MMP14 and depend on its activity for proliferation in collagenous environments. (A–C), Relative average expression of fibrillar collagen (fCOL) (A), collagen biosynthesis and crosslinking (COLbio) (B), and collagen‐cleaving matrix metalloproteinases (MMPs) (C), in normal myometrium (MM; n = 31), uterine leiomyoma (LM; n = 28), and uterine leiomyosarcoma (uLMS; n = 17). One‐way ANOVA with post hoc Tukey's test. (D) Relative average expression of MMPs in uLMS and other uterine sarcomas included in the cohort (other Sarc; n = 17). Two‐tailed Student's t‐test. (E) Representative examples of MMP14 protein staining in LM (n = 12) and uLMS (n = 9) tissues. Scale bar indicates 100 μm. (F) Quantification of the percentage of the area of the tissue positive for MMP14 in LM (n = 12) and uLMS (n = 9) tissues, indicating higher MMP14 protein expression in uLMS. Each datapoint represents one patient; horizontal bars indicate the average per tissue type. Two‐tailed Student's t‐test. (G) Association between high expression of fCOL, COLbio and MMP genes and uLMS patient prognosis of the TCGA cohort (n = 24). Patients groups were generated by the best cut‐off method, favourable/unfavourable survival was defined as significant changes of median survival (P < 0.05). (H, I) Metascape pathway analysis of the genes upregulated (H) and downregulated (I) in uLMS tumours with low fraction of high‐density matrix (HDMlow; n = 10) compared with HDMhigh (n = 8) uLMS tumours. (J) Representative images of SKUT1 cells in 3D collagen gels 4 days after MMP14 knockdown (n = 3 independent experiments). Scale bar indicates 50 μm. (K) Proliferative (Ki67+) and apoptotic (Cleaved‐caspase 3+) cell quantification from (J) (n = 3 independent experiments). One‐way ANOVA with post hoc Tukey's test. (L) Quantification of the response of patient‐derived uLMS and low‐grade endometrial stromal sarcoma (LG‐ESS) cells to NSC405020. Each data point indicated the average of 3 technical replicates. *P < 0.05, **P < 0.01, ***P < 0.001.
