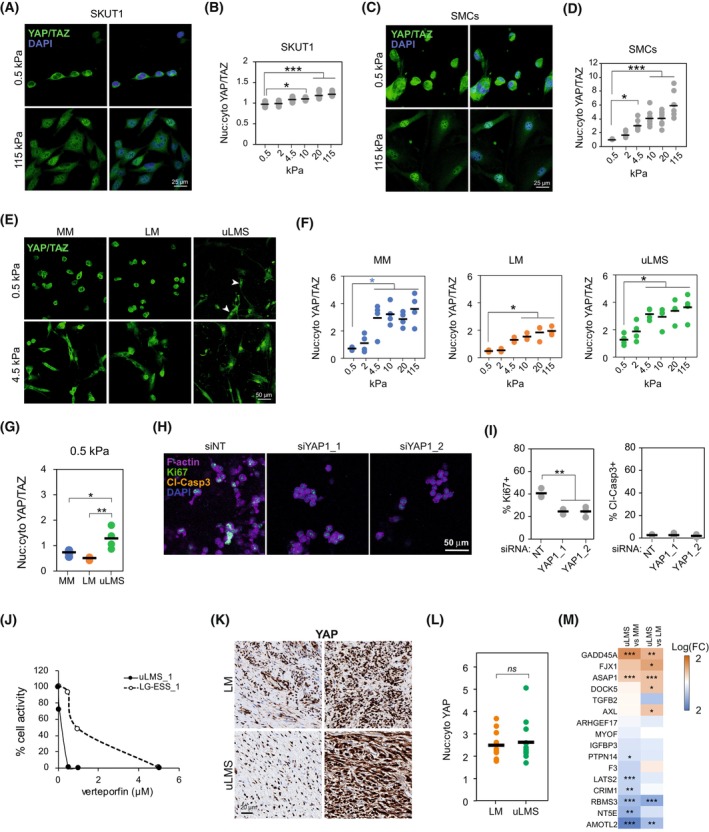
Fig. 4.

Enhanced YAP activation in uLMS supports cell proliferation in soft collagenous substrates. (A, B) Representative images (A) and quantification (B) of YAP/TAZ subcellular localisation in SKUT1 cells adhered to PAA hydrogels at indicated stiffness (n > 71 cells per condition). One‐way ANOVA with post hoc Tukey's test. Scale bar indicates 25 μm. (C, D) Representative images (C) and quantification of YAP/TAZ subcellular localisation in primary smooth muscle cells (SMCs) adhered to PAA hydrogels at indicated stiffness (n > 49 cells per condition). One‐way ANOVA with post hoc Tukey's test. Scale bar indicates 25 μm. (E, F) Representative images (E) and quantification (F) of YAP/TAZ subcellular localisation in normal myometrium (MM; n = 4 donors), leiomyoma (LM; n = 3 donors), and uterine leiomyosarcoma (uLMS; n = 4 donors) cells adhered to indicated stiffness. One‐way ANOVA with post hoc Tukey's test. Arrowheads indicate cells with nuclear YAP/TAZ. Scale bar indicates 50 μm. (G) Comparison of YAP/TAZ nuclear:cytoplasmic ratio in MM (n = 4 donors), LM (n = 3 donors), uLMS (n = 4 donors) cells adhered to soft 0.5 kPa PAA hydrogels showing increased nuclear YAP/TAZ in uLMS cells. One‐way ANOVA with post hoc Tukey's test. (H) Representative examples of SKUT1 cells embedded in 3D collagen matrices 4 days after YAP siRNA knockdown (n = 3 independent experiments with more than 500 cells counted per condition). Scale bar indicates 50 μm. (I) Proliferative (Ki67+) and apoptotic (Cleaved‐caspase 3+) cell quantification from (H) (n = 3 independent experiments with more than 500 cells counted per condition). One‐way ANOVA with post hoc Tukey's test. (J) Quantification of the response of 3D collagen‐embedded patient‐derived uLMS and low‐grade endometrial stromal sarcoma (LG‐ESS) to verteporfin based on total ATP content (n = 3 technical replicates). (K, L) Representative images showing two distinct examples of LM and uLMS tissues stained for YAP (K) and quantification of nuclear:cytoplasmic YAP ratio showing no difference between the tissues (LM n = 10 and uLMS n = 14). Scale bar indicates 20 μm. Two‐tailed Student's t‐test. (M) Differential gene expression of YAP target genes between uLMS and MM and between uLMS and LM tissues. Two‐tailed Student's t‐test. *P < 0.05, **P < 0.01, ***P < 0.001.
