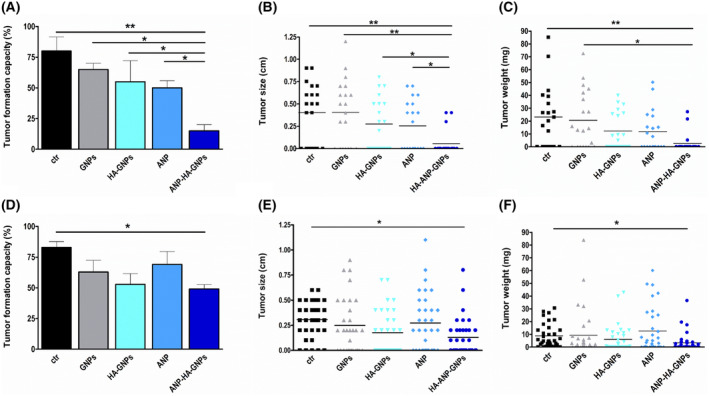
Fig. 4.

Quantification of tumor formation from grafted retinoblastoma (RB) cells after gold nanoparticle treatment in chorioallantoic membrane (CAM) assays. Tumor formation capacity (A, B), CAM tumor weight (B, E) and CAM tumor size (C, F) of etoposide resistant RB cells was quantified after treatment with GNPs, HA‐GNPs, ANP, or ANP‐HA‐GNPs. Upper row (A–C) shows the results for Y79‐Etop cells and lower row (D–F) data for WERI‐Etop cells. ANP, atrial natriuretic peptide; ANP‐HA‐GNP, ANP coupled HA‐GNPs; ctr, PBS treated; GNP, gold nanoparticles; HA‐GNP, hyaluronic acid coupled GNPs. Values are means of three independent experiments ± SEM. *P < 0.05; **P < 0.01 statistical differences compared to the control group calculated by one‐way ANOVA with Newman–Keuls post‐test.
