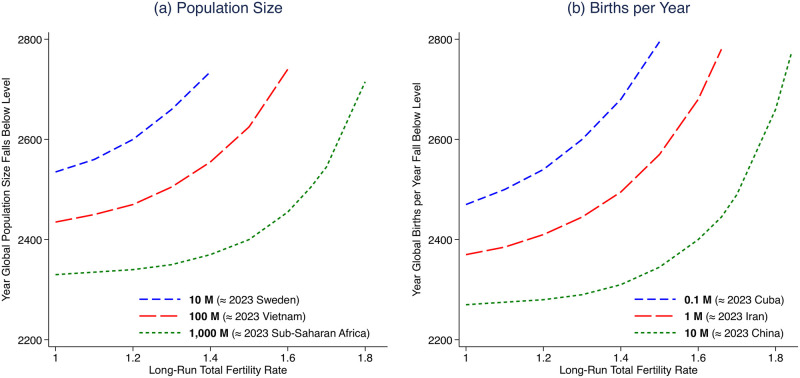
Fig 2. Longest-term consequences for population size of alternative long-run global fertility rates.
(a) plots iso-population curves and (b) plots iso-births curves. Each line indicates the combination of global fertility rates and dates that result in the indicated population or annual birth milestone. For example, if global fertility converges to 1.4 births per woman, then there are projected to be 1 billion people in 2370 and 1 million births per year in 2495.

