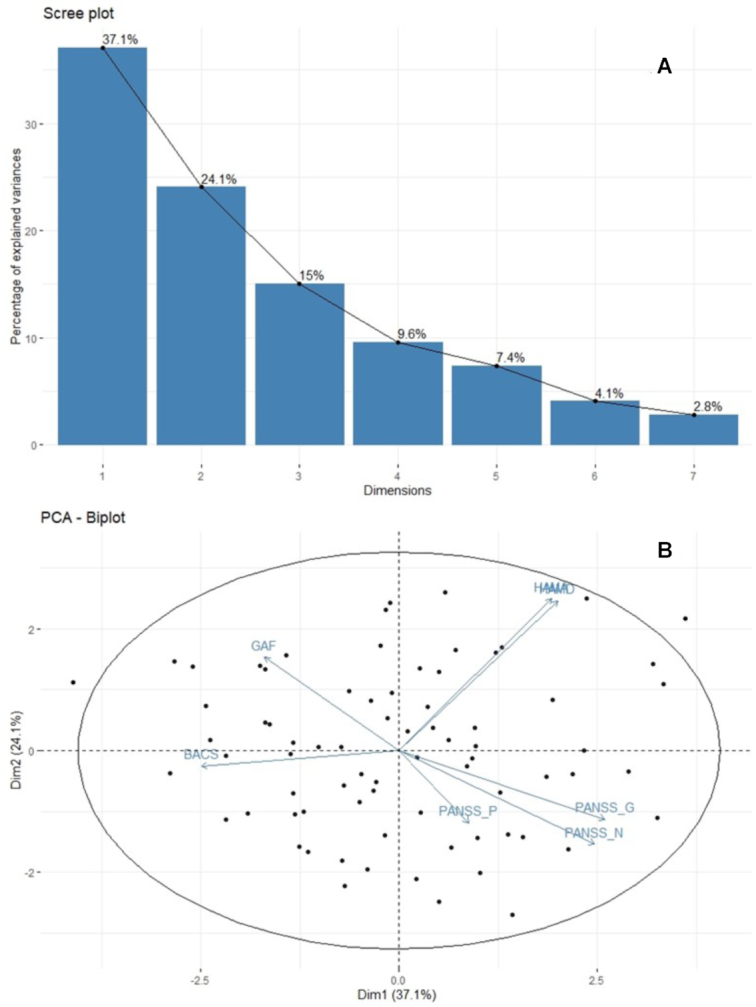
Figure 2:

Results of PCA on clinical scales. (A) The scree plot of the percentage of explained variance of each PC. (B) Variables factor map. Arrows represented the loadings of each clinical scales on the first two dimensions and the dots represented individual scores. Abbreviation: Dim, dimension.
