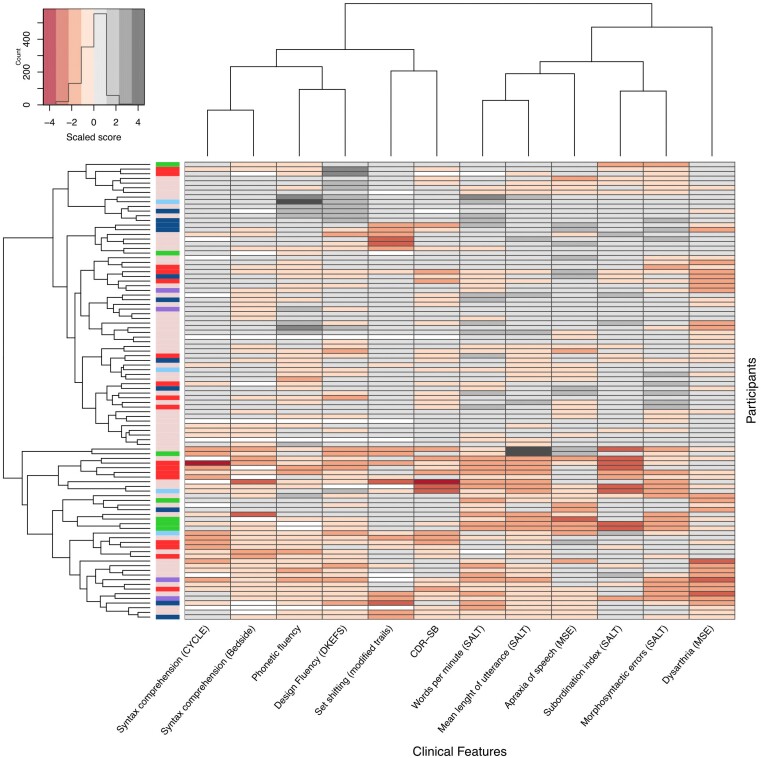
Figure 2.
Clustered heat map of all participants. The clustered heat map illustrates the lack of robust clinical clusters within the nfvPPA-spectrum. The first unlabelled column relates to the neuropathological data of each participant [pink = no autopsy available; red = corticobasal degeneration (CBD); dark blue = progressive supranuclear palsy (PSP); green = Pick’s disease; light blue = frontotemporal lobar degeneration characterized by phosphorylated 43-kDa TAR DNA-binding protein inclusions (FTLD-TDP) type A; purple = other pathologies]. Each labelled column represents its corresponding clinical feature, and each row represents a participant. The scores for all clinical features have been scaled to allow their comparison. The participants and the variables have been ordered based on similarity, as illustrated by dendrograms on the top (variables) and left (participants). CDR-SB = Clinical Dementia Rating Sum of Boxes; CYCLE = Curtiss Yamada Comprehensive Language Evaluation; DKEFS = Delis-Kaplan Executive Function Scale; MSE = motor speech evaluation; SALT = Systematic Analysis of Language Transcripts.

