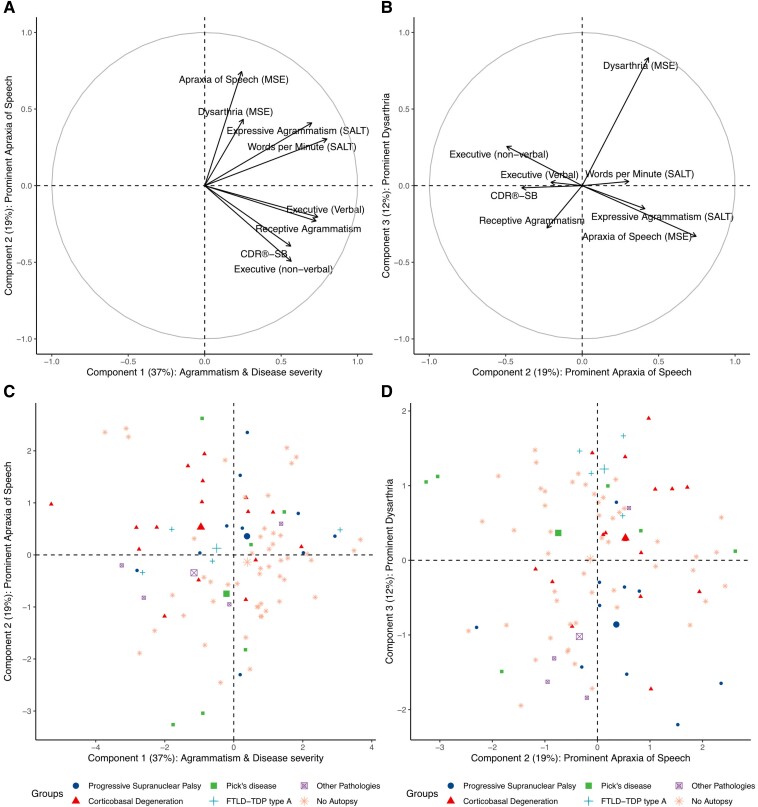
Figure 3.
Characterization of latent clinical dimensions derived from principal component analysis. In all panels, the x- and y-axes represent one of the three latent clinical dimensions (or ‘clinical components’) derived from principal component analysis (PCA). The percentage of variance explained by each component is shown in parentheses. In A and B, the value at the x- and y-axes represent the standardized coefficient (relative weight) of the components derived from PCA (higher values indicating a more substantial contribution to a given component). Each variable included in the PCA is represented by an arrow whose orthogonal projection to the x- and the y-axes indicates its standardized coefficient for the corresponding component. (A) The relative contribution of each variable to Component 1 (characterized by agrammatism, reduced verbal fluency and higher disease severity) and Component 2 (represented by prominent apraxia of speech and less disease severity and executive dysfunction). (B) The relative contribution of each variable to Component 2 and Component 3 (characterized by prominent dysarthria with less apraxia of speech). (C and D) The individual loadings for each component (lower individual loadings representing more impaired performance). Each participant’s neuropathological diagnosis (if available) is shown in the legend of C and D. For each neuropathological category, the centroid of the ellipse encompassing each group is represented by the biggest symbol. Notably, the distribution of individual loadings did not reveal clusters of participants but rather a widespread distribution. (C and D) The x- and y-axes represent the individual loading for one of the three components derived from PCA in C and D. CDR-SB = Clinical Dementia Rating sum-of-boxes; CYCLE = Curtiss Yamada Comprehensive Language Evaluation; DKEFS = Delis-Kaplan Executive Function Scale; FTLD-TDP type A = frontotemporal lobar degeneration characterized by phosphorylated 43-kDa TAR DNA-binding protein inclusions; LCD = latent clinical dimension; MSE = motor speech evaluation; SALT = Systematic Analysis of Language Transcripts.

