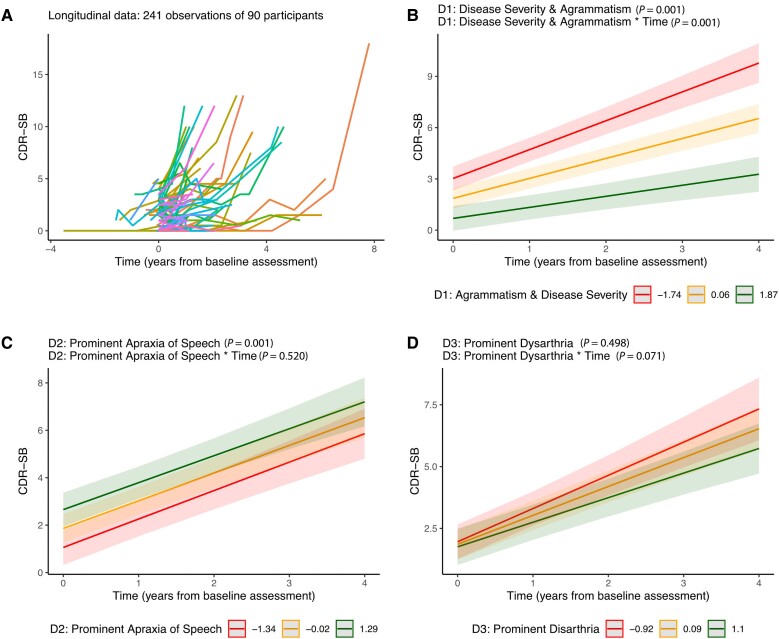
Figure 5.
Baseline predictors of faster longitudinal decline. (A) Spaghetti plot representing longitudinal data. (B–D) CDR-SB estimates were obtained from linear mixed-effects models as a function of individual loading for Components 1, 2 and 3. For illustrative purposes, we show the CDR-SB estimates for each tercile. Error bars represent 95% confidence intervals and lower values for each latent clinical component represent more impaired performance. D1 = component 1; D2 = component 2; D3 = component 3; CDR-SB = Clinical Dementia Rating Sum of Boxes.

