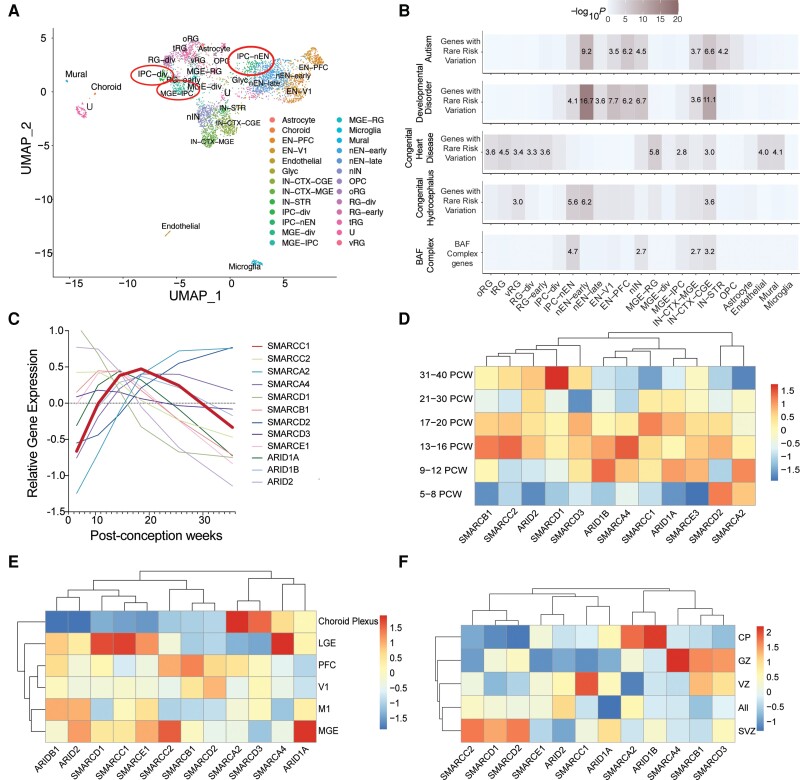
Figure 2.
SMARCC1 is expressed in intermediate progenitors of the cortical lamina during human brain development. (A) Analysed transcriptomic dataset26 showing uniform manifold approximation and projection (UMAP) clustering of developmental human brain cells, coloured by cell type. EN-PFC = early and late born excitatory neuron prefrontal cortex; EN-V1 = early and late born excitatory neuron V1; IN-CTX-CGE = caudal ganglionic eminence (CGE)/lateral ganglionic eminence (LGE)-derived inhibitory neurons; IN-CTX-MGE = medial ganglionic eminence (MGE)-derived cortex inhibitory neuron; IN-STR = striatal neurons; IPC-div = dividing intermediate progenitor cells radial glia (RG)-like; IPC-nEN = intermediate progenitor cells excitatory neuron (EN)-like; MGE-div = dividing MGE progenitors; MGE-IPC = MGE progenitors; MGE-RG = MGE radial glia; Mural = mural/pericyte; Nen-early = newborn excitatory neuron-early born; nEN-late = newborn excitatory neuron-late born; nIN = MGE newborn neurons; OPC = oligodendrocyte progenitor cell; oRG = outer radial glia; RG-div = dividing radial glia; RG-early = earlyvRG; tRG = truncated radial glia; U = unknown; vRG = ventricular radial glia. Expression in neural progenitors is featured in red circles. (B) Analysed transcriptomic dataset26 showing enrichment analysis across cell type markers of the developmental human brain for genes with rare risk variation in autism, developmental disorders, congenital heart disease and congenital hydrocephalus compared to BAF complex genes. Tiles labelled with −log10(P-value) and an asterisk represent significant enrichment at the Bonferroni multiple-testing cut-off (α = 0.05/23 = 2.17 × 10⁻³). (C) Temporal gene expression profiles for SMARCC1 and other BAF complex genes between post-conception weeks (PCW) 5–36. (D) Analysed transcriptomic dataset26 showing heat map of gene expression levels for SMARCC1 and other BAF complex genes across different developmental time points. Vertical axis shows time points in post-conception weeks. (E) Analysed transcriptomic dataset26 showing heat map of gene expression levels for SMARCC1 and other BAF complex genes across different brain regions. V1 = primary visual cortex; M1 = primary motor cortex. (F) Analysed transcriptomic dataset26 showing heat map of gene expression levels for SMARCC1 and other BAF complex genes across cortical lamina, PCW 5–40. CP = cortical plate; GZ = germinal zone; VZ = ventricular zone; SVZ = subventricular zone.

