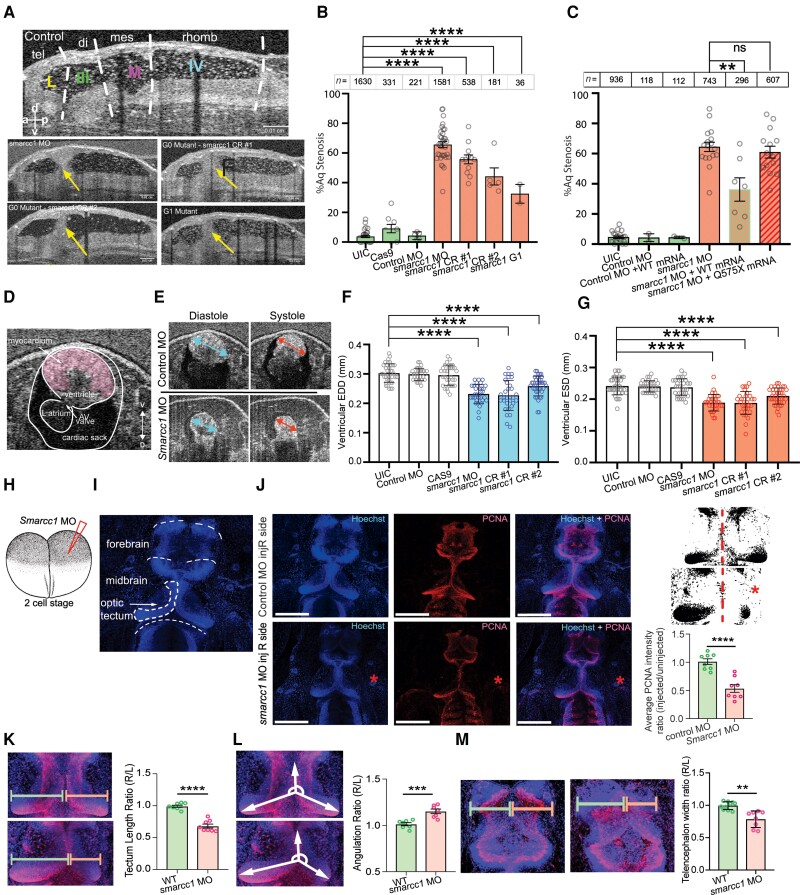
Figure 3.
SMARCC1 mutation causes hydrocephalus by disrupting midbrain architecture in Xenopus tropicalis. (A) Mid-sagittal view of the Xenopus ventricular system. Dotted white lines indicate boundaries between labelled regions: tel = telencephalon; di = diencephalon; mes = mesencephalon; rhomb = rhombencephalon; L = lateral ventricle; III = third ventricle; M = midbrain ventricle; IV = fourth ventricle. Representative mid-sagittal views for experimental conditions (G0 variant from morpholino oligo, G0 variant from CRISPR #1, G0 variant from CRISPR #2, and G1 variant progeny from Smarcc1 MO animals) are shown with aqueductal occlusion marked by arrows. (B) Quantification of per cent aqueductal stenosis in uninjected controls (UIC); Cas9 control and control MO, as well as in the experimental conditions Smarcc1 MO, Smarcc1 CRISPR #1, Smarcc1 CRISPR #2 and Smarcc1 G1 variant. Data are shown as mean ± standard error of the mean (SEM). Open circles indicate the number of experiments, with animal counts indicated above each column. Significance was calculated by one-way ANOVA; ****P ≤ 0.0001. (C) Quantification of rescue of aqueductal stenosis phenotype with Smarcc1 MO + WT mRNA (P = 0.0024) with recapitulation of phenotype by pathogenic mRNA from p.Q575* variant (P = 0.4888). Data are shown as mean ± SEM. Open circles indicate number of experiments, with animal counts indicated above each column. Significance was calculated by Mann-Whitney test. (D) Representative X. tropicalis cardiac OCT image on ventral-dorsal axis, the ventral three chamber view (VTCV). Labelled structures are myocardium, ventricle, left atrium, AV valve and cardiac sack. (E) Representative cardiac measurements by OCT shown for UIC and smarcc1 MO. EDD = end diastolic diameter; ESD = end systolic diameter. (F) Quantification of EDD in UIC, Cas9 control and control MO, as well as experimental conditions smarcc1 MO, smarcc1 CRISPR #1 and smarcc1 CRISPR #2. Data are shown as mean ± SEM. Significance was calculated by one-way ANOVA using GraphPad Prism. ****P ≤ 0.0001. (G) Quantification of ESD in UIC, Cas9 control and control MO, as well as experimental conditions smarcc1 MO, smarcc1 CRISPR #1 and smarcc1 CRISPR #2. Data are shown as mean ± SEM. Significance was calculated by one-way ANOVA using GraphPad Prism. ****P ≤ 0.0001. (H) Schematic of two-cell injection protocol in X. tropicalis. (I) Labelled representative fluorescence microscopy of wild-type (WT) stage 46 X. tropicalis stained with Hoechst. Olfactory bulb, forebrain, midbrain, optic tectum and cerebellum are indicated. (J) Representative immunofluorescence images of right side-injected control MO and right side-injected Smarcc1 MO stage 46 X. tropicalis for PCNA (red) and merged images (with Hoechst, blue). Scale bar = 500 um. Schematic and chart for quantification of average PCNA intensity ratio for control and smarcc1 MO injected on the right side with left side uninjected, P ≤ 0.0001 with unpaired t-test. Data are shown as mean ± SEM. (K) Schematic and chart for quantification of optic tectum length ratio for wild-type control and Smarcc1 MO injected on the right side with left side uninjected, P ≤ 0.0001 with unpaired t-test. Data are shown as mean ± SEM. (L) Schematic and chart for quantification of optic tectum angulation ratio for wild-type control and Smarcc1 MO injected on the right side with left side uninjected, P = 0.0008 with unpaired t-test. Data are shown as mean ± SEM. (M) Schematic and chart for quantification of telencephalon width ratio for wild-type control and Smarcc1 MO injected on the right side with left side uninjected, P = 0.0019 with unpaired t-test. Data are shown as mean ± SEM. ns = not significant; OCT = optical coherence tomography.

