Figure 4.
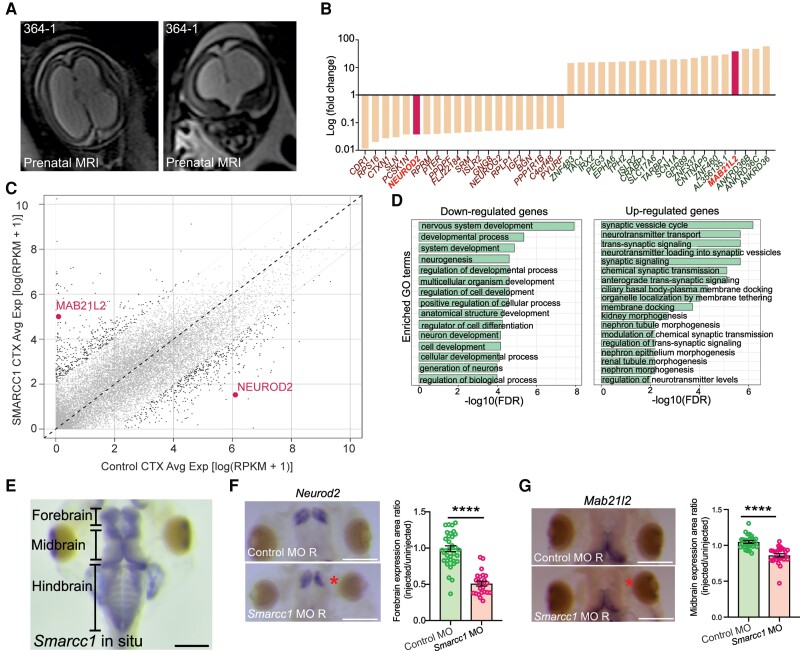
SMARCC1 mutation dysregulates transcription factors involved in intermediate progenitor biology in human and Xenopus tropicalis. (A) Prenatal ultrasound imaging for Patient CHYD364-1 demonstrates severe cerebral ventriculomegaly and aqueductal stenosis. (B) Median fold-change of top 20 differentially expressed genes. NEUROD2 and MAB21L2 are highlighted. (C) Dot plot showing differentially expressed genes between SMARCC1 variant and control CTX samples. Each dot represents a gene. The x- and y-axes represent average gene expression in control and variant samples, respectively. Genes with a fold change >5 between samples are in black; others are in grey. MAB21L2 and NEUROD2 are highlighted with text. (D) Gene ontology (GO) analysis of congenital hydrocephalus risk genes, including ranked and selected terms. Significance was calculated by two-sided Fisher’s exact test. Scale bar = 500 μm. (E) Representative photomicrograph of DNA in situ hybridization showing Smarcc1 expression in wild-type stage 46 of X. tropicalis. The forebrain, midbrain and hindbrain are indicated. Scale bar = 500 μm. (F) Representative photomicrographs of DNA in situ hybridization showing Neurod2 expression in stage 46 X. tropicalis, control and Smarcc1 MO-injected on the right side, with left side uninjected. Quantification of forebrain expression area is shown, P ≤ 0.0001 with unpaired t-test. Data are shown as means ± SEM. Scale bar = 500 μm. (G) Representative photomicrographs of DNA in situ hybridization showing Mab21l2 expression and quantification as in F. Scale bar = 500 μm.

