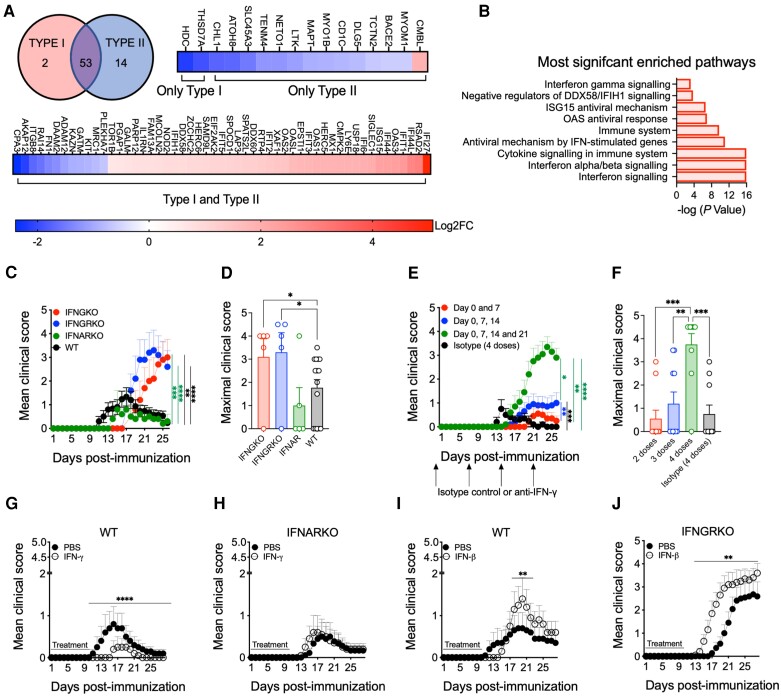
Figure 1.
Opposing roles of type I and type II interferons in the regulation of neuromyelitis optica spectrum disorder and AQP4201–220-induced disease. (A) Venn diagram and differentially expressed genes (DEGs) following Interferome analysis for type I and type II IFN-regulated genes (a total of 69 of 87 genes regulated by IFNs) from whole blood of untreated neuromyelitis optica spectrum disorder (NMOSD) patients versus healthy donors obtained from publicly available RNA sequencing data (see ‘Materials and methods’ section). (B) Reactome pathway enrichment analysis of DEGs (total of 87 DEGs). Mean clinical score (C) and maximal clinical score (D) were evaluated in AQP4201–220-immunized wild-type (WT) (black, n = 15), IFN-γ-knockout (IFNGKO; red, n = 5), IFN-γ-receptor knockout (IFNGRKO; blue, n = 5) and type I IFN-receptor knockout (IFNARKO; green, n = 5) mice. Mean clinical scores (E) and maximal clinical scores (F) were recorded in AQP4201–220-immunized WT mice treated with two (red, n = 10), 3 (blue, n = 10) or four (green, n = 10) weekly doses starting from Day 0 of anti-IFN-γ, or isotype control antibodies (filled circles, total of four doses, n = 10). Administration of IFN-γ to WT (G) and IFNARKO (H), or IFN-β to WT (I) and IFNGRKO (J) mice was performed for 10 days beginning on the day of immunization (n = 10). All data are presented as mean ± standard error of the mean (SEM). Statistical analyses were performed using the Mann–Whitney test. *P < 0.05, **P < 0.01, ***P < 0.001.

