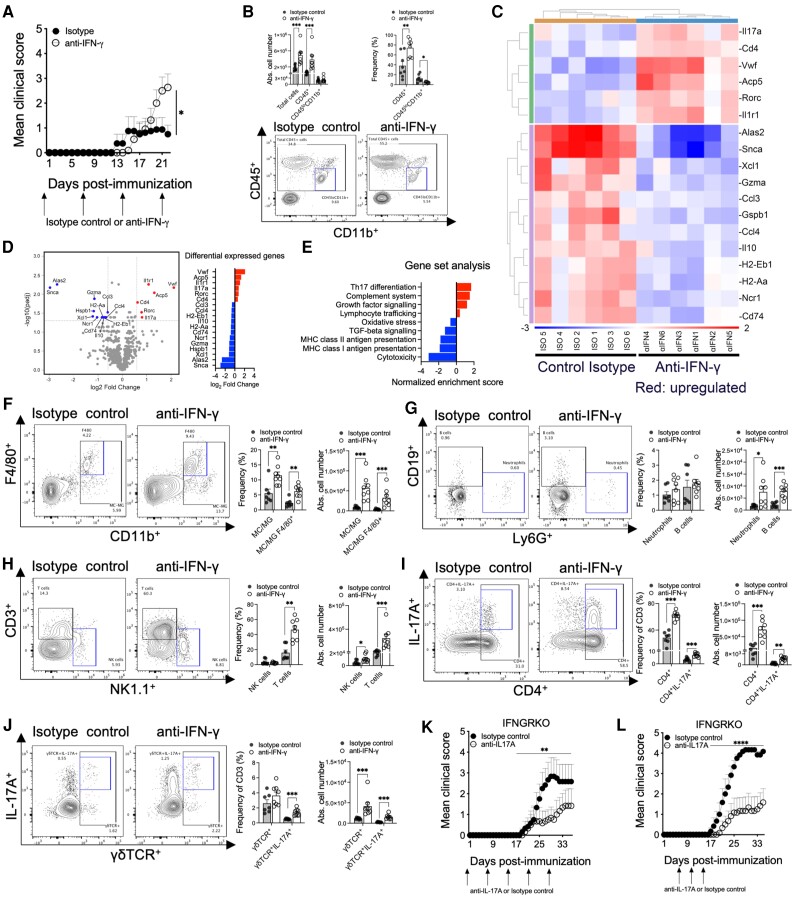
Figure 4.
Anti-IFN-γ enhancement of AQP4201–220-induced disease is driven by Th17 cells. Mean clinical scores of AQP4201–220-immunized wild-type (WT) mice treated with anti-IFN-γ (four doses, open circles, n = 8) or isotype control (four doses, filled circles, n = 11) until Day 22 post-immunization (p.i.) (A). Absolute cell number of mononuclear cells obtained from the spinal cords of anti-IFN-γ-treated (n = 8) and isotype control-treated (n = 7) groups (B). CD45+ and CD45loCD11b+ cell number and frequency were analysed by flow cytometry. Total RNA from mononuclear cells obtained from the spinal cord of anti-IFN-γ-treated (n = 6) and isotype control-treated (n = 6) groups were analysed, and a hierarchical heatmap clustering was created based on the most differentially expressed genes (C). A Volcano plot of RNA profiles comparing anti-IFN-γ versus isotype control treatments, and pathway enrichment analysis of the most differentially expressed gene sets (D and E). Absolute cell number and frequencies of monocytes/macrophages (MC)/activated microglia (MG; CD45hi), MC/MG F4/80+, Neutrophils Ly6G+, NK (NK1.1+), CD3+, CD4+, CD4+17A+, γδTCR+, γδTCR+IL-17A+, CD19+ cells were determined by flow cytometry analyses (F–J). Administration of anti-IL-17A (open circles) or isotype control (filled circles) antibodies to IFNGRKO mice, as weekly doses beginning at Day 0 (K) or three doses beginning at Days 6, 10 and 14 p.i. (n = 6) (L). All data are presented as mean ± SEM. Statistical analyses were performed using the Mann–Whitney test. *P < 0.05, **P < 0.01** and ***P < 0.001.

