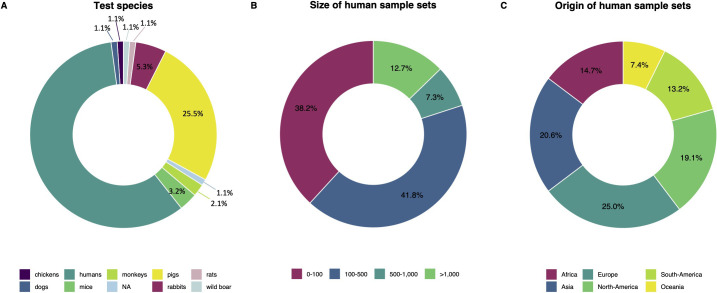
Fig 4. Characteristics of test species and human sample sets.
Panel A displays the proportion of sample sets that involved a particular test species. Panel B indicates the size of the human sample sets. Panel C provides insights into the origin of the human sample sets. Certain sample sets were re-used and therefore reported in multiple records, resulting in multiple counts in panels A and B. To create panel C, we considered that a reported sample set might contain samples from different origins (e.g., positive samples from Africa, negative samples from Europe), and treated these as distinct human sample sets in our origin analysis. S3 Info provides an overview of the 85 records used in the analyses.

