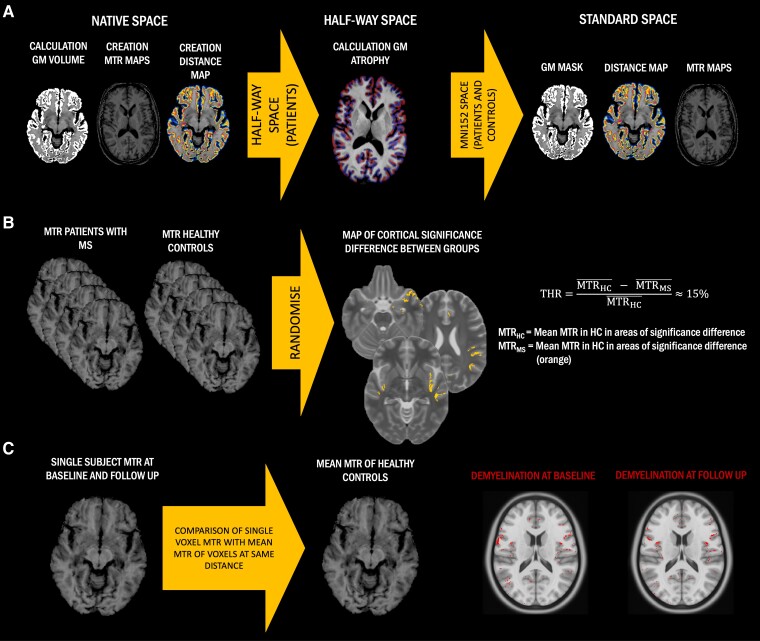
Figure 1.
Simplified method flow chart. (A) Cross-sectional grey matter (GM) volume, magnetization transfer ratio (MTR) maps and distance maps were created in native space in all subjects and then normalized to standard space, passing through the half-way space in patients. In half-way space, T1-weighted images were used to calculate cortical GM atrophy using the Jacobian integration method. (B) Definition of a threshold (THR) to identify cortical demyelinated voxels in people with multiple sclerosis (pwMS) compared to healthy controls (HCs). Regions of significant group differences between MTR maps of people with MS and HCs were identified through voxel-wise non-parametric permutation-based t-test. For each centre, from these regions of significant difference, mean MTR in people with MS and HCs were extracted and used to calculate a relative percentage difference, which was defined as the threshold for cortical demyelination. (C) Classification of cortical demyelinated voxels in people with MS. We calculated the relative difference between the MTR value of any given cortical voxel in people with MS and the average MTR value of all voxels in HCs localized at the same distance as the given voxel from the external CSF. If this difference was greater than the previously calculated threshold, that cortical voxel was classified as ‘demyelinated’, otherwise as ‘normally myelinated’. As a result, we generated a map of cortical demyelination for each patient at each time point.

