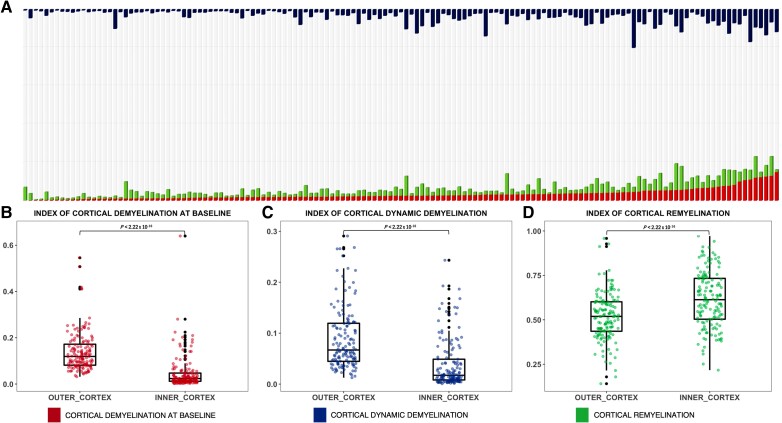
Figure 3.
The three indices of cortical myelin content change are largely heterogeneous across patients and affected by the distance from CSF. (A) Cortical myelin content change is represented by a bar plot in which each bar represents the cortex of a single patient: cortical voxels classified as demyelinated at baseline and follow-up are highlighted in red; cortical voxels classified as remyelinated are in green; and cortical voxels classified as dynamically demyelinated are in blue. Bars are sorted based on demyelination at baseline. B–D show the differences between the inner and outer cortex in the extent of cortical demyelination (B), dynamic demyelination (C) and remyelination (D).

