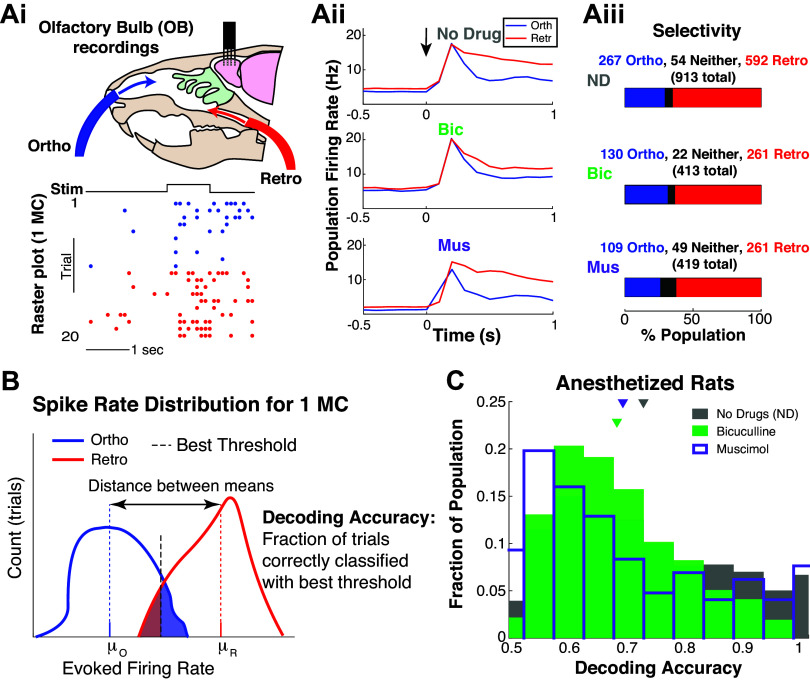
Figure 1.
Individual mitral cells encode modality. Ai: experiment setup to test whether OB MCs encode ortho versus retro stimulation, with example raster plot for 1 MC. Aii: population-averaged firing rate (trial- and population-averaged), i.e., PSTH for each modality and drug preparation; t = 0 denotes when ethyl butyrate (EB, a food odor) is presented. Aiii: the proportion of population that fire more for ortho (or retro), i.e., ortho selective ⇔ higher trial-averaged firing rate for ortho than retro in 0.9 s after odor onset. B: schematic of how decoding accuracies are calculated for each MC based on trial firing rates: μR/0 are the trial-averaged firing rates. Shaded regions correspond to incorrect decoding, unshaded regions to correct decoding. C: distribution of decoding accuracies of MC with three different preparations: intact no drug (gray), less inhibition via Bic (green), and more inhibition via Mus (purple). Mean decoding accuracy for no drug is 0.724; with Bic and Mus the means are: 0.680, 0.690 (resp.). Differences are all statistically significant (α = 0.01 with two-sample t test assuming unequal var, Wilcoxon rank-sum test, and one-way ANOVA) with mostly “medium” effect size, see Table 3. Time window Tev = 0.9 s was determined systematically, see Fig. A2, A and C, and materials and methods. Bic, bicuculline; MC, mitral cell; Mus, muscimol; PSTH, peristimulus time histogram.

