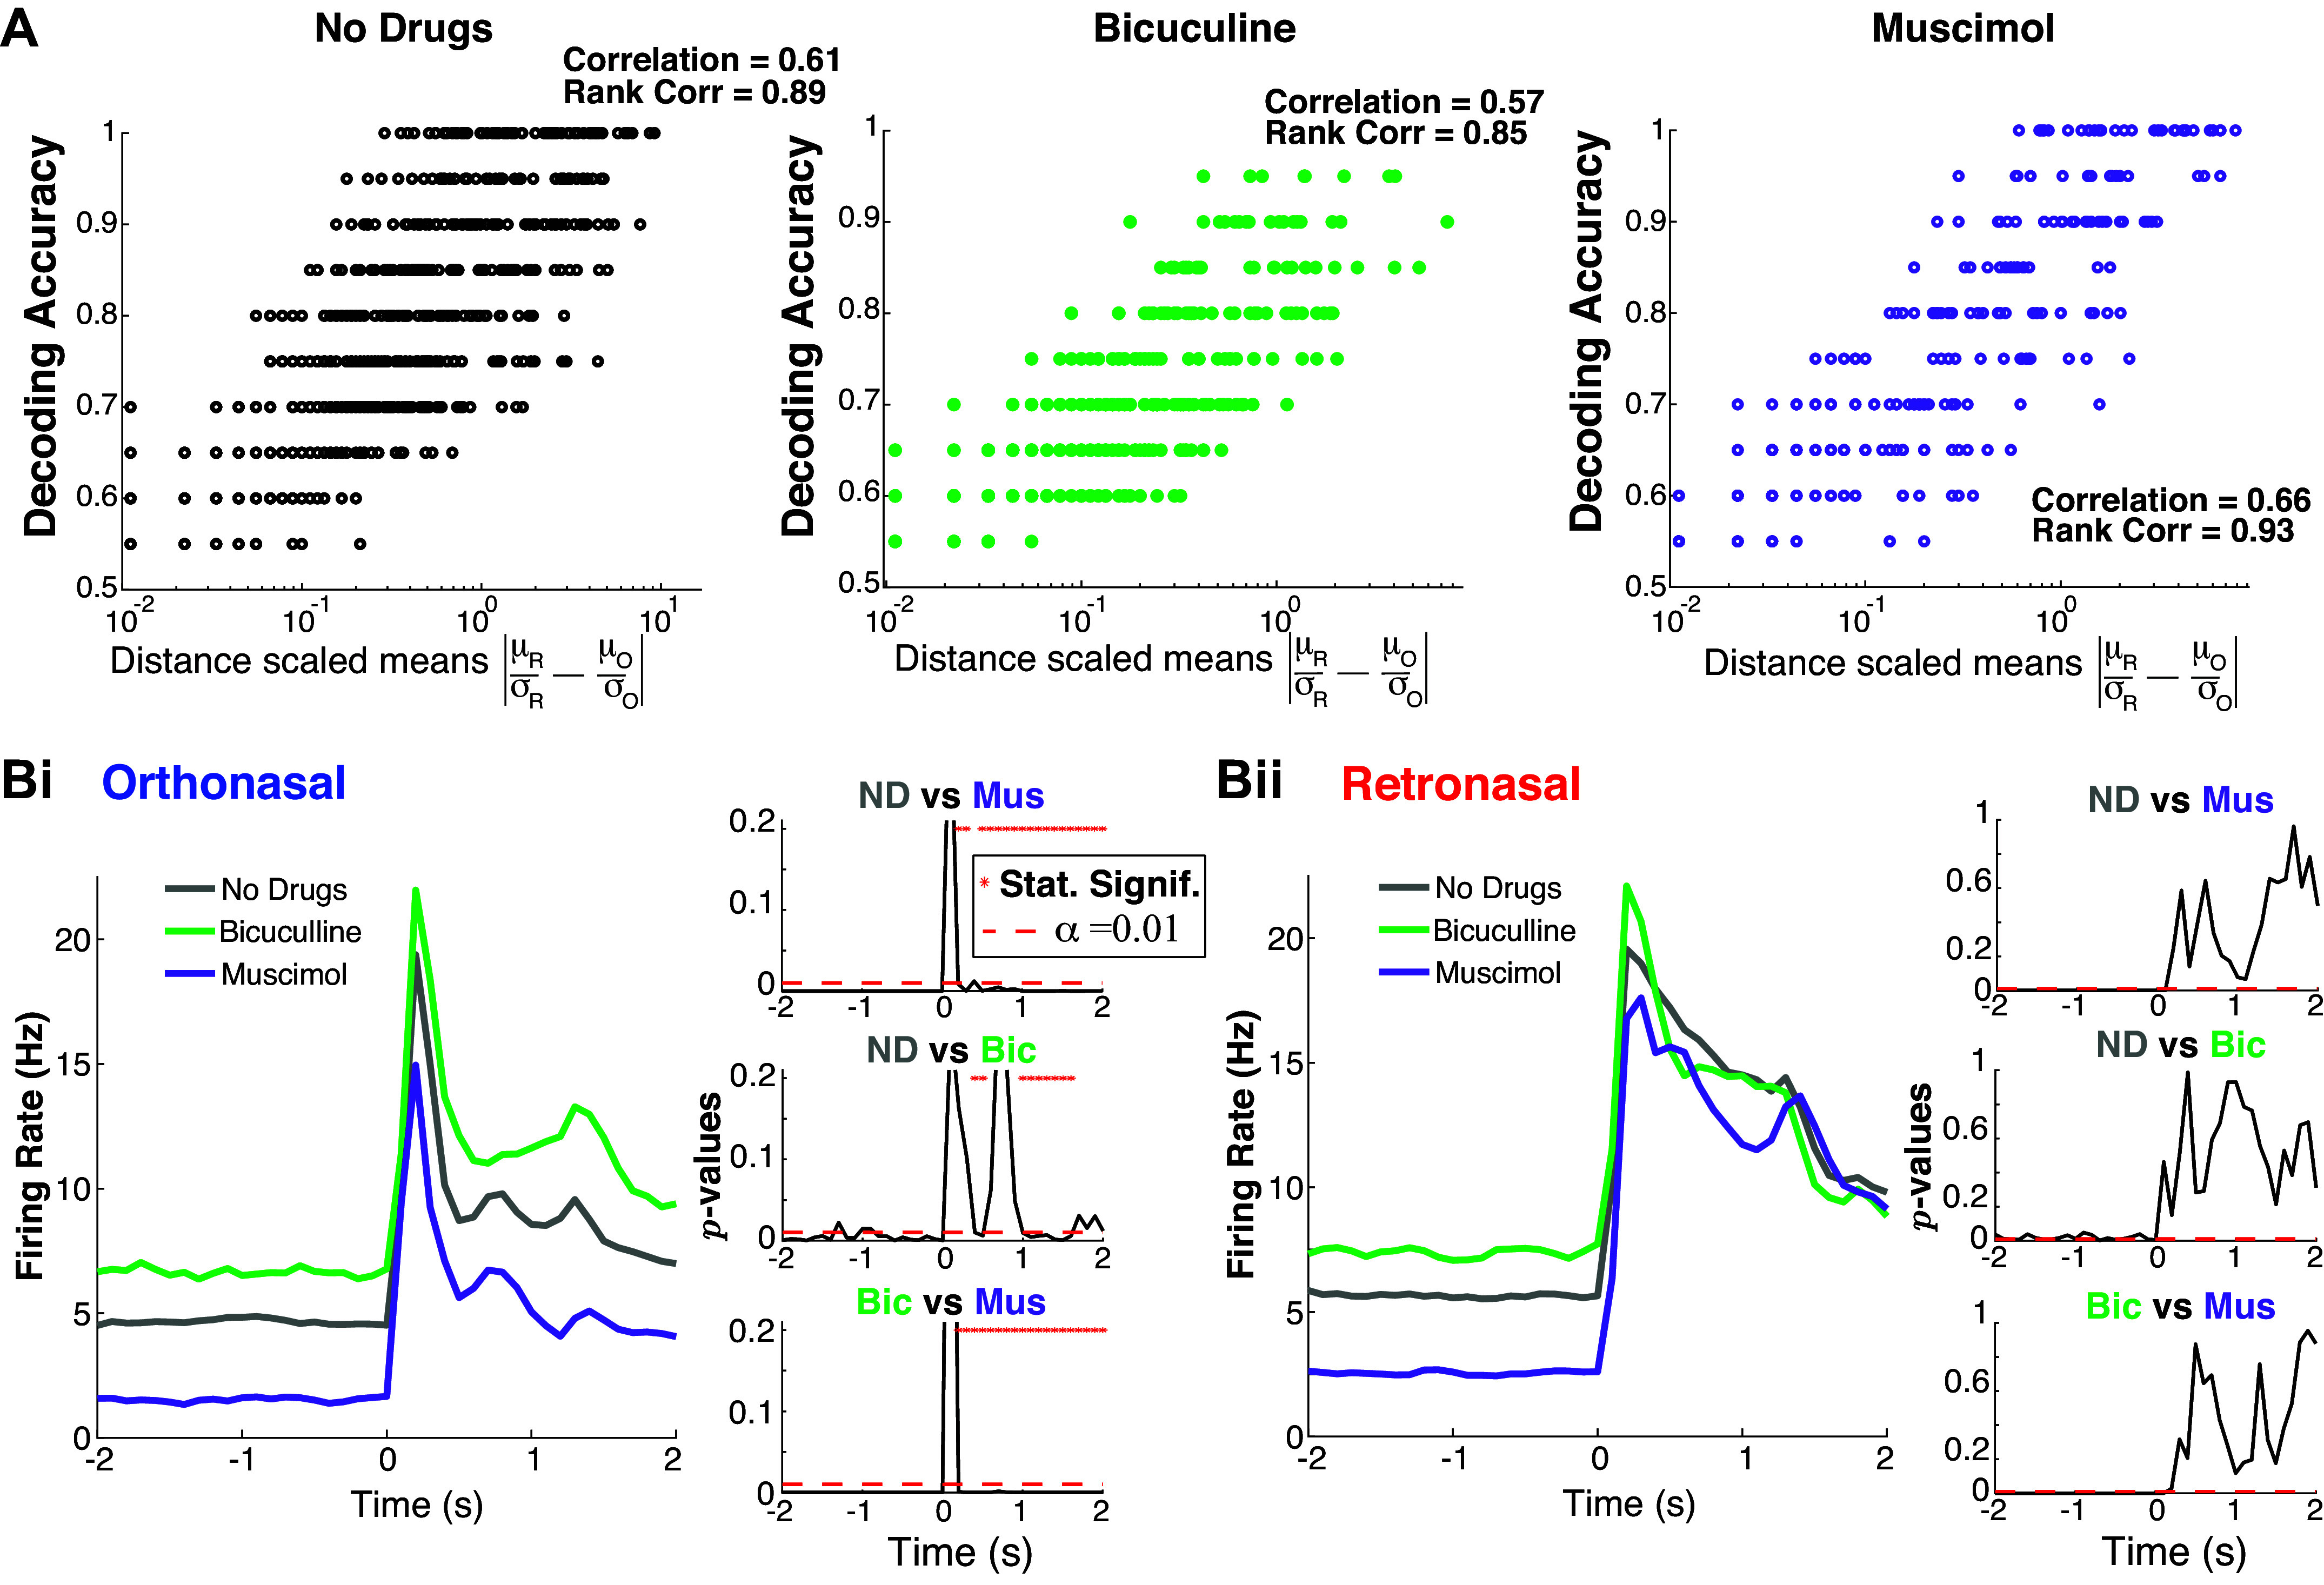
Figure 3.

Population activity: retronasal response is less affected by changes in OB inhibition. A: distance between scaled trial-averaged mean is correlated with decoding accuracy. The “Correlation” is Pearson’s correlation coefficient, and “Rank Correlation” is Spearman’s. B: drug effects on evoked population PSTH are different with statistically significant effects only with ortho stimulation (Bi) but not retro (Bii). The right panels with three subplots show the time series of P values from two-sample t test assuming unequal variances, comparing pairs of drug preparations. Bic, bicuculline; Mus, muscimol; ND, no drug; OB, olfactory bulb; PSTH, peristimulus time histogram.
