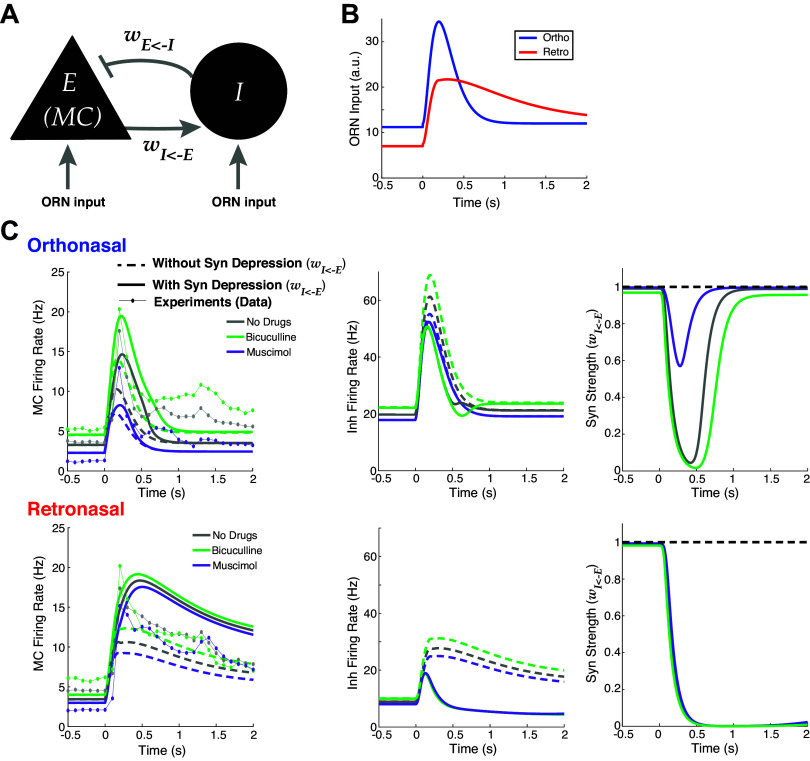
Figure 4.
Firing rate model captures effects of drugs, with better alignment with data when including synaptic depression. A: schematic of reciprocally coupled E-I pair. B: fixed ORN input profiles for ortho and retro based on experiments (1–3, 30, 31) (see main text). C: Wilson-Cowan firing rate model (Eqs. 6–12) output for ortho (top) and retro (bottom) stimulation, compared when synaptic depression is included (solid lines) or not (dashed lines). Left column: E cell (MC) output; center column: I cell output; right column: synaptic strengths (WIE). Data from experiments also shown for comparison (dot-lines) in left column. E-I, excitatory-inhibitory; MC mitral cell; ORN, olfactory receptor neuron.

