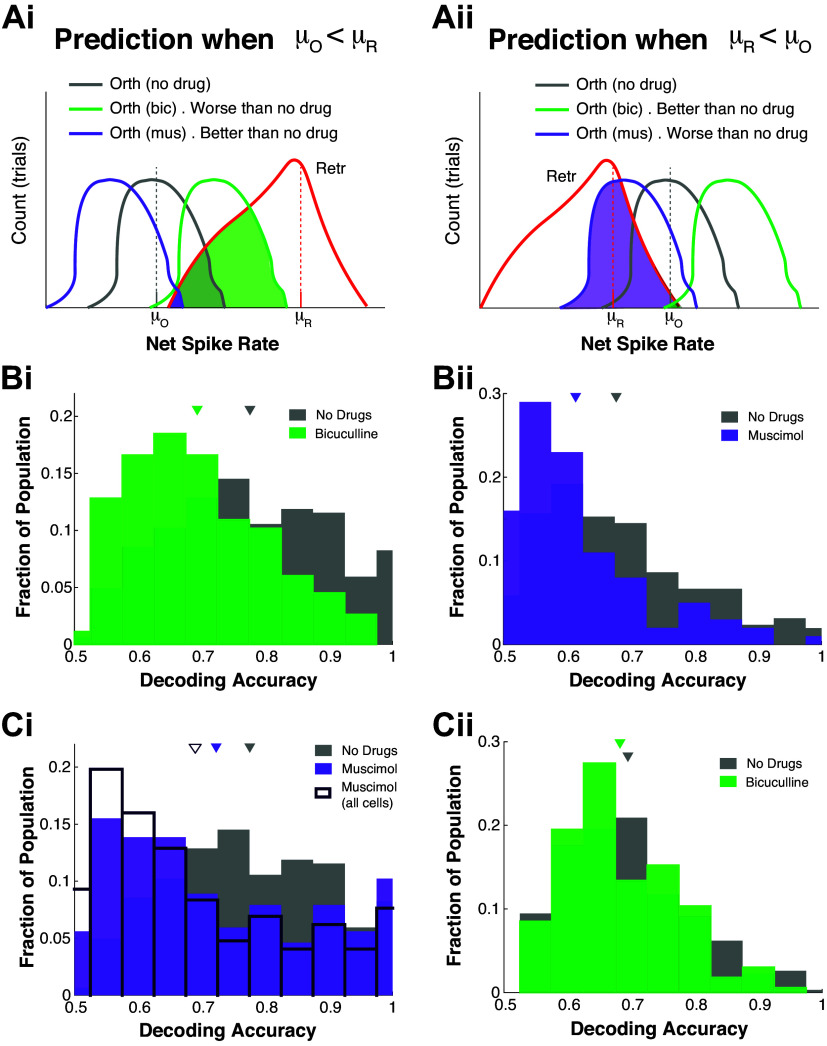
Figure A4.
Decoding accuracy dynamics from drug effects on population-averaged firing rates. Left: cells where μ0 < μR. Right: cells where μR < μ0. Ai and Aii: predicted decoding accuracy for different drug preparations. Histogram of decoding accuracies for no drug and Bic when μ0 < μR (Bi), and no drug with muscimol when μR < μ0 (Bii); triangle is mean decoding accuracy over all such MCs. Differences in middle row (Bi and Bii) are statistically significant. Ci: histogram of decoding accuracies for no drug and muscimol when μ0 < μR, also showing the histogram for muscimol decoding accuracy for all cells (i.e., not only those where μ0 < μR) in dark purple outline. Although no drug is better than muscimol, muscimol with cells μ0 < μR have better decoding than all cells with muscimol. Cii: no drug and Bic when μR < μ0 do not have statistically significant differences in mean. See text for P values. Bic, bicuculline; MC, mitral cell.

